
Figure 6.
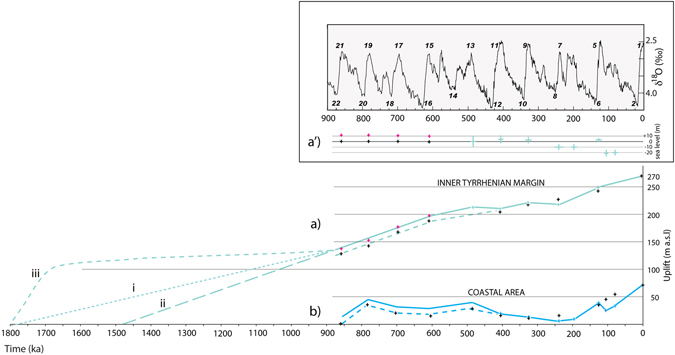
Uplift history. The uplift affecting the investigated area since 900 ka (green solid line) is assessed based on elevation of the terraced surfaces correlated with the MISs (black crosses) corrected for the different sea-level with respect to present day at each interglacial (a′; green crosses). The coeval uplift assessed on the Tyrrhenian Sea coast is also shown (blue line; ref. 12). Three different uplift histories are hypothesized for the 1.8–0.9 Ma interval, assuming a constant rate since 1.8 Ma to reach the elevation at MIS 21 (i), assuming the same rate as that characterizing the 0.9–0.5 Ma interval (ii), and considering biostratigraphic data from Monte Mario and Monte Riccio (see text) suggesting a sea-level fall of ca. 120 by 1.7 Ma (iii). Isotopes curve in a′ hand drawn with Adobe© Illustrator CS3 13.0.0 graphic program.