
Figure 7.
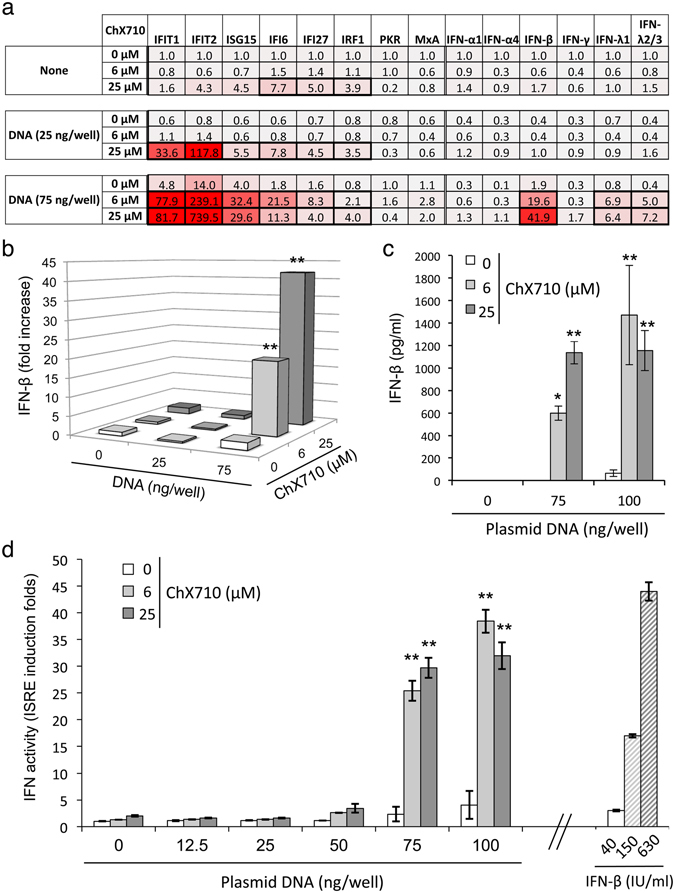
Synergistic induction of ISGs and IFN-β by DNA transfection and ChX710. (a) ISRE-luciferase reporter cells were transfected with 25 or 75 ng/well of plasmid DNA (pCiNeo-3xFlag-GW), and cultured at 4 × 10⁴ cells/well in 96-well plates with DMSO alone or ChX710 at 6 or 25 μM. After 24 hours of incubation, total RNA were extracted and expression levels of specified genes were determined by RT-qPCR. Data were normalized with using RPL13A mRNA expression as reference, and expressed as induction folds relative to DMSO-treated cells using the 2−ΔΔCt method. Induction folds >3 that are statistically significant between untreated and ChX710-treated wells are framed with bold lines (two-way ANOVA and Bonferroni’s post hoc test; P < 0.05). (b) Data corresponding to IFN-β mRNA expression levels as in (A) are presented as 3D histograms to highlight the synergistic effect of DNA transfection and ChX710 treatment. (c) HEK-293 cells were transfected with 75 or 100 ng/well of plasmid DNA (pCiNeo-3xFlag-GW), and cultured at 4 × 10⁴ cells/well in 96-well plates with DMSO alone or ChX710 at 6 or 25 μM. After 48 hours of incubation, culture supernatants were recovered, tested for IFN-β concentration by ELISA. (d) Same as in (c) but culture supernatants were applied at a ½ dilution to fresh ISRE-luciferase reporter cells to determine interferon activity. As a reference, reporter cells were stimulated with recombinant IFN-β at 40, 150 or 630 IU/ml. After 24 hours of incubation, luciferase activity was determined. Data represent means ± SD of three independent experiments. *P < 0.05 and **P < 0.01 correspond to statistically significant differences between untreated and ChX710-treated wells (two-way ANOVA and Bonferroni’s post hoc test).