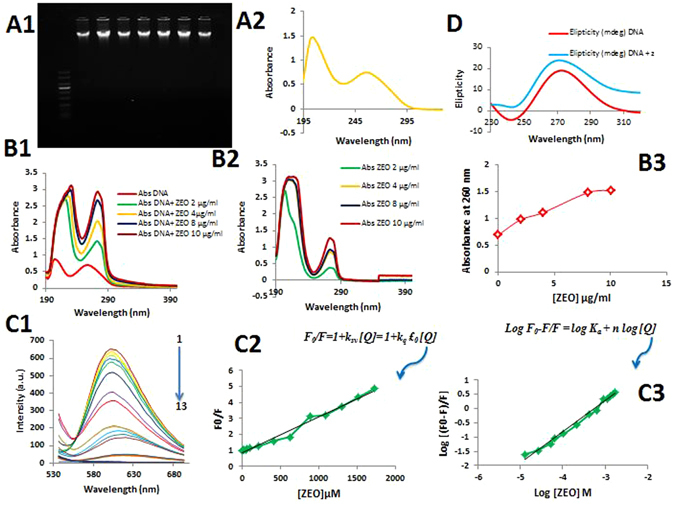
Figure 8.

(A1,A2) High molecular weight DNA on 0.8% agarose gel after 40 min electrophoresis at 5 v/cm and UV–Visible spectra of rat hepatocyte genomic DNA. (B1,2,3) UV absorption spectra of a: 0–32 μg/ml of ZEO, b: DNA with various concentrations Of ZEO c: DNA/ZEO absorption at 260 nm (C1) Fluorescence quenching spectra of EB–DNA solutions (CEB = 2.6 μM, CDNA = 50 μg/ml) upon addition of increasing amounts of ZEO (2–224 μg/ml) (pH = 7.4, T = 310 K, ex = 500 nm, em = 530–700 nm). (C2,C3) Stern–Volmer plots for the mechanism fluorescence quenching of EB–DNA by ZEO (D) Circular dichroism spectra of the rat hepatocyte genomicDNA (100 μg/ml) and DNA/ZEO (16 μg/ml) at 298 K.
