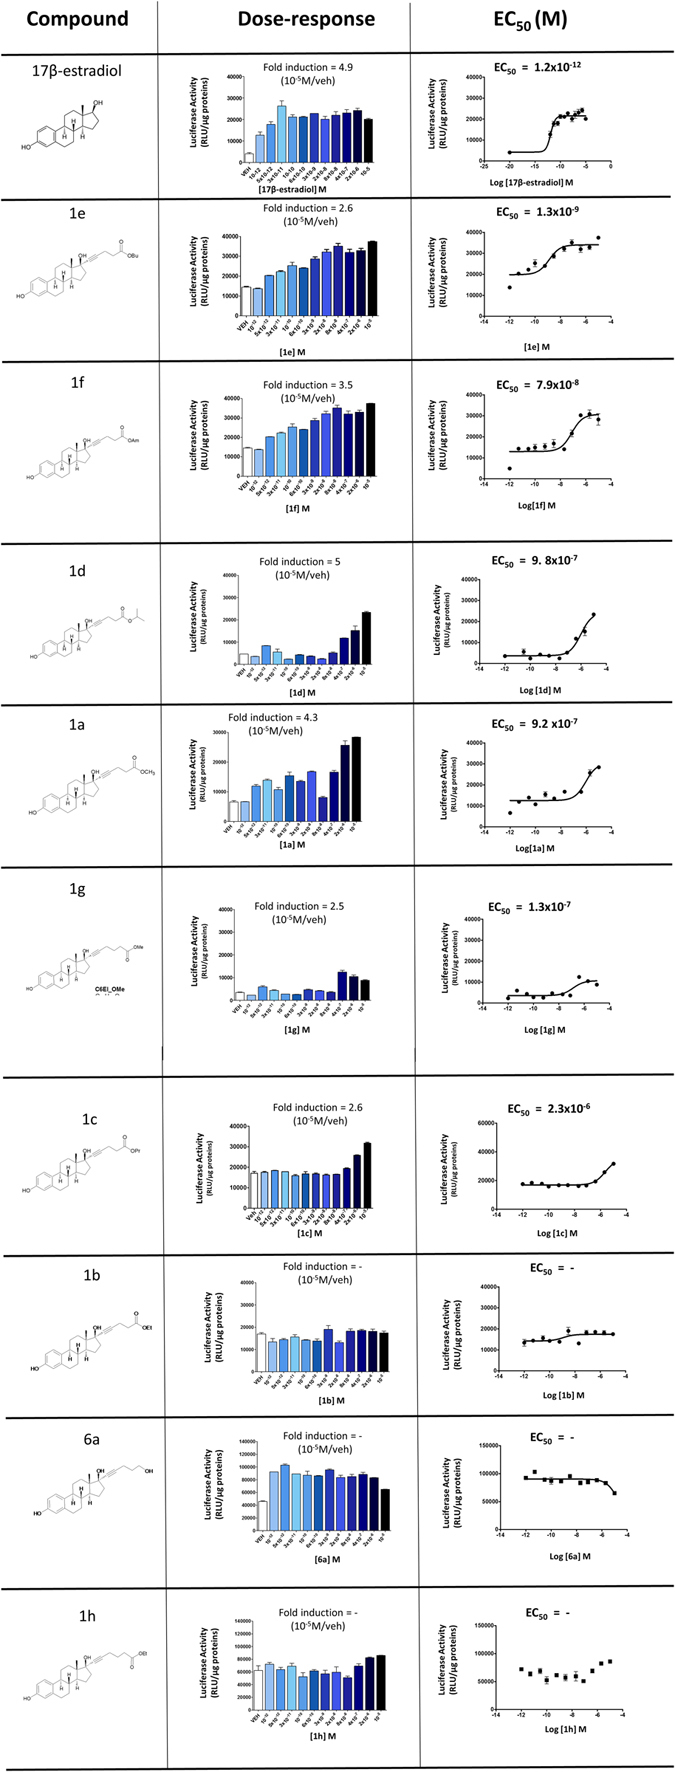
Figure 3.

Compounds: chemical structure of tested compounds. Dose-response: ER transcriptional activity measured as luciferase activity in the presence of increasing concentrations of indicated compounds in the ERE-Luc B17 cells, fold induction of luciferase activity measured at 10-5 M of indicated compound respect to vehicle. EC50: plotting of the transactivation data for EC50 calculation by means of sigmoidal dose-response (variable slope) using PRISM5 software.
