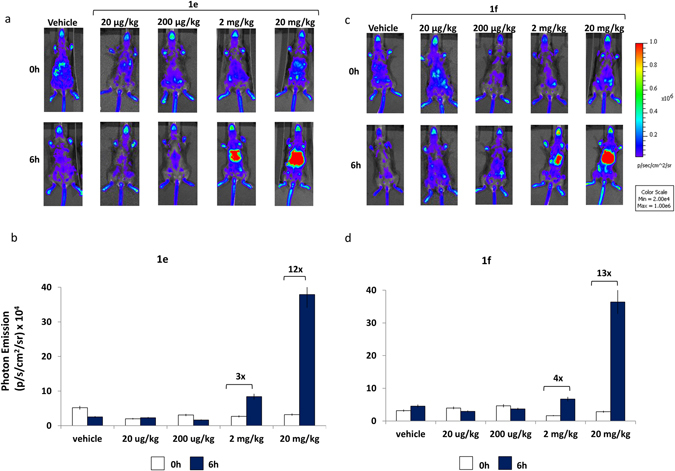
Figure 4.

Effect of NCE on ER transcriptional activity in living ERE-Luc mice: dose- response. (a) Optical imaging of ERE-Luc mice at 0 and 6 hours after treatment with the indicated dosages of 1e compound. Photos portray whole body (ventral view) of a representative individual in a pseudocolor image indicating the intensity of photon emission from the different body areas. (b) In vivo BLI: quantification of photon emission whole body at 0 and 6 hours after injection of 1e at indicated dosages. (c) Optical imaging of ERE-Luc mice at 0 and 6 hours after treatment with the indicated dosages of 1f compound. Photos portray whole body (ventral view) in a pseudocolor image processed to indicating the intensity of photon emission from the different body areas of a representative animal for each group. (d) Whole body photon emission quantification at 0 and 6 hours after 1f treatment at indicated doses. Bars correspond to mean +/− SEM (n = 4).
