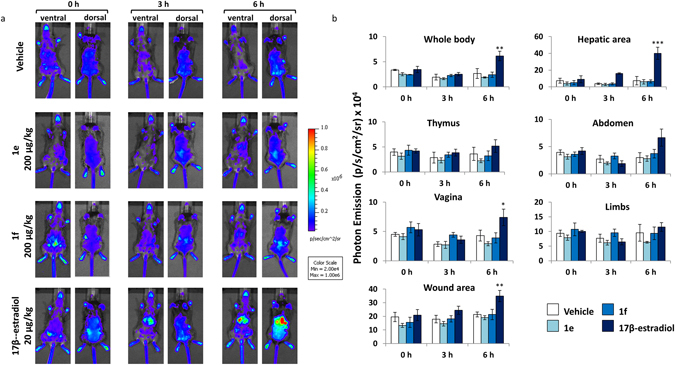
Figure 5.

Time-course analysis of ER activity in selected body areas after administration of synthetic and natural estrogens. (a) Optical imaging of ERE-Luc mice at 0, 3 and 6 hours after the s.c. injection of the indicated compounds. Photos portray whole body (ventral and dorsal view) pseudocolor images representing the amount of photon emission. Each individual is representative of its own group. (b) In vivo BLI: photon emission from selected body areas were measured. Bars represent the mean +/− SEM of photon emission measured in 4 animals/group. *p < 0.05; **p < 0.01; ***p < 0.001 vs time 0 ANOVA followed by Bonferroni’s test for multiple comparisons.
