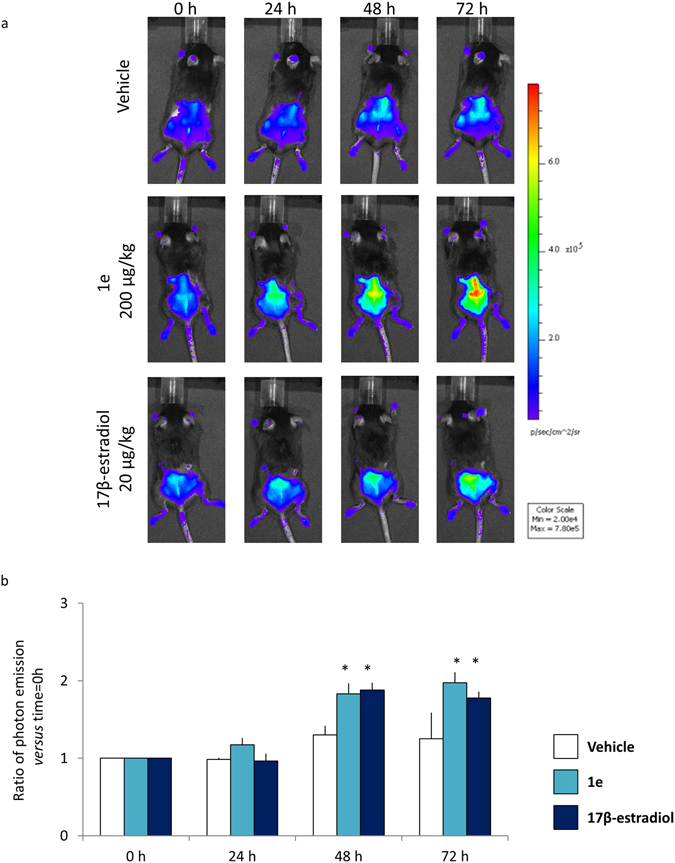
Figure 8.

Proliferation analysis. (a) In vivo wound healing bioluminescence imaging of MITO-Luc after indicated treatments. Photos portray whole body (dorsal view) at 0, 24, 48, 72 hours after treatments, in a pseudocolor image processed to indicate the intensity of photon emission in wound areas. (b) In vivo BLI: quantification of photon emission in the wound area at the indicated time point. Each bar represents the mean ratio versus time = 0 h +/− SEM of photon emission measured in 4 animals/group. *p < 0.001 vs time 0, ANOVA followed by Bonferroni’s test for multiple comparisons.
