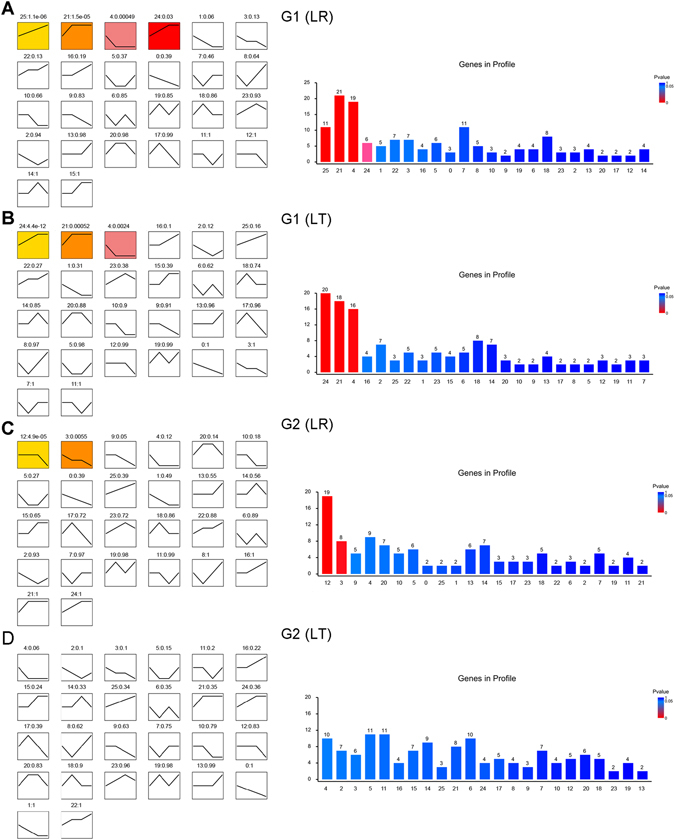
Figure 5.

STEM analysis of gene expression profiles. (A–D) Each box indicates a model expression profile; the colored profiles represent profiles that reached statistical significance. The numbers in the box provide the order of the profile (upper left) and the P-value indicating significance (upper right). Histograms on the right show the number of genes involved in each expression profiles; and the lowest to highest P-values are marked from red to blue in the graph.
