Figure 2.

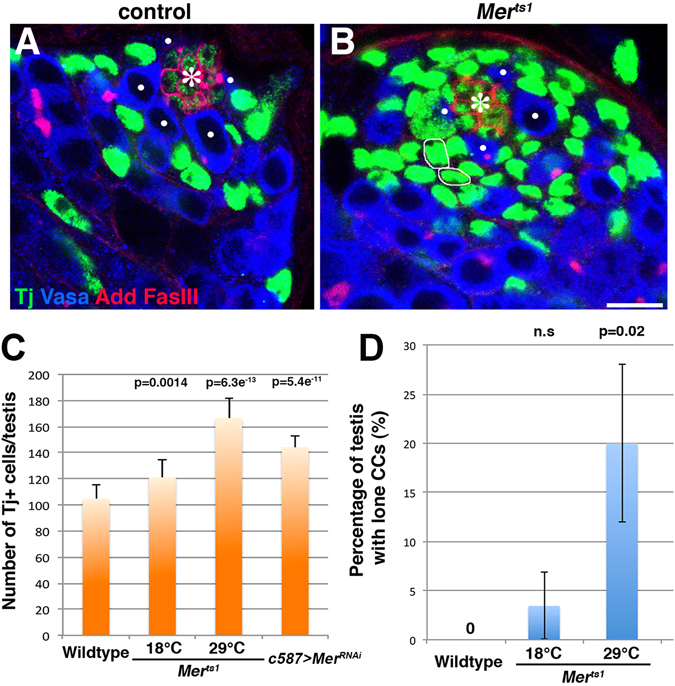
CCs are increased in number upon loss of Mer function.(A and B) The testis apical tip stained for Tj (green), Vasa (blue), adducin-like (Add), and fasciclin III (Fas III, red) in a control (A) and (Mer ts1) mutant (B) testis. Circles in (B) indicate Tj+ cells without clear association with germ cells (“lone CCs”). GSCs are indicated by white dots. Hub (*). Bar, 10 µm. (C) The number of Tj+ cells/testis in control, Mer ts1, and c587 > Mer RNAi testes. Data are expressed as the mean ± SD, and p values were obtained using the Student’s t test (two-tailed) by comparing to wild type. N = 15 testes for data point. (D) The frequency of testes containing lone CCs in control and Mer mutants. N ≥ 40 testes for data point.
