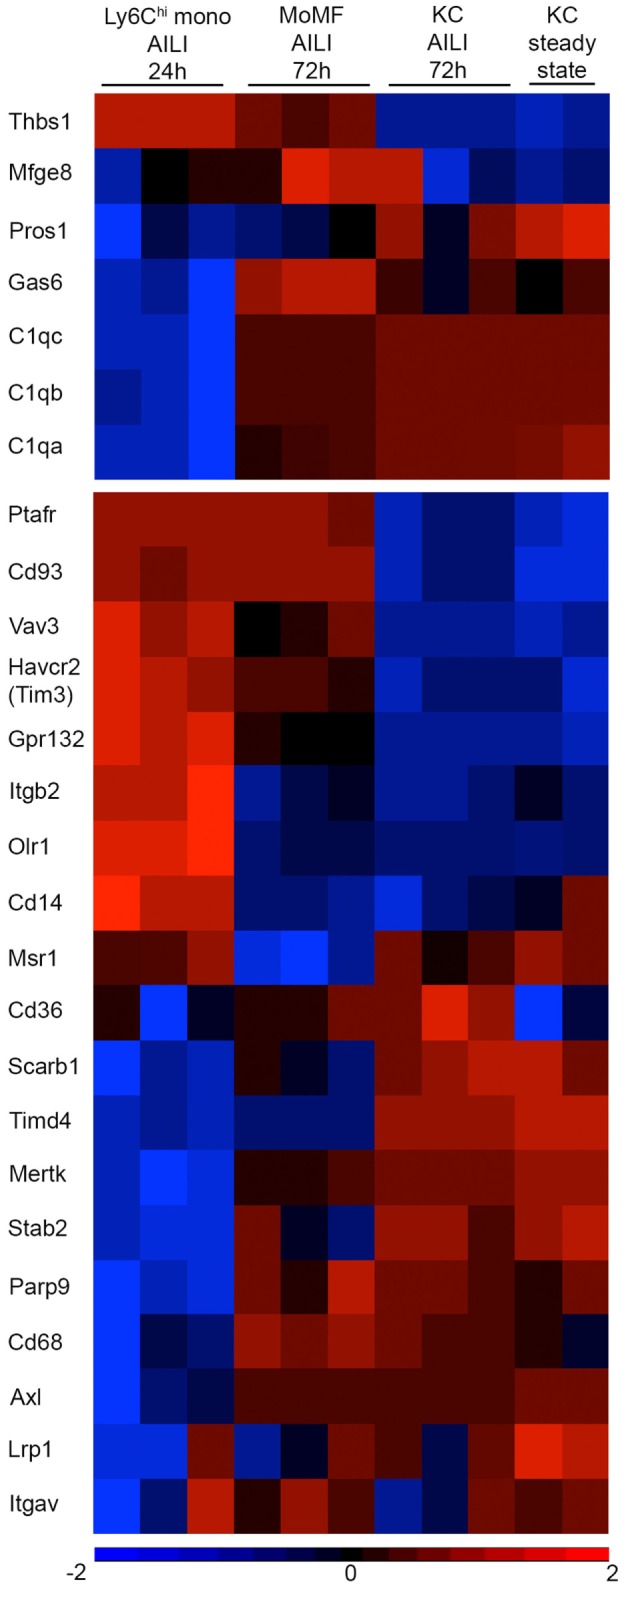
Figure 7.

Variable expression of apoptotic cell bridging molecules and receptors between Ly6Chi monocytes, monocyte-derived macrophages (MoMF), and Kupffer cell (KC). Heat map analysis generated using Partek Genomics Suite version 6.6 (Partek, St. Louis, MO, USA). The heat maps show the fold-change gene-expression differences of bridge molecules (upper panel) and macrophage receptors (lower panel) involved with apoptotic cell clearance. The heat map presents comparison between Ly6Chi monocytes [acetaminophen-induced liver injury (AILI) 24 h], MoMF (AILI 72 h), and KC (steady state and AILI 72 h). Color legend is presented at the bottom of the figure. Statistical significance for specific genes is mentioned as p-value in the text and was analyzed by ANOVA followed by Bonferroni’s multiple comparison test. These results were analyzed out of a published database (22).
