Fig. 2.
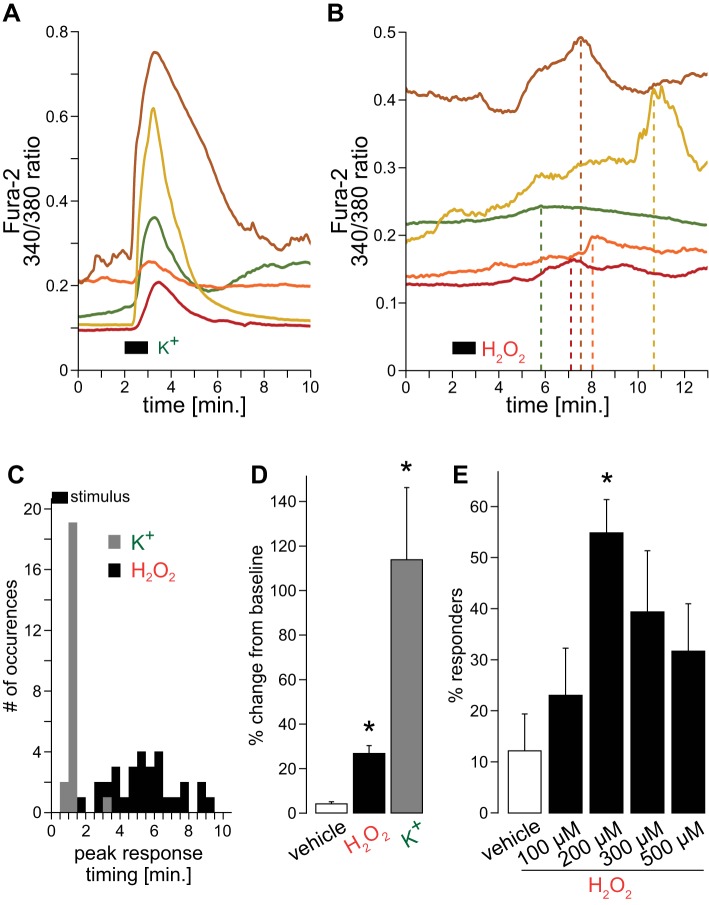
Effects of H2O2 on cytosolic Ca2+ in nTS cells. A: typical raw traces of cytosolic Ca2+ levels (using fura-2) to 1 min of high K+ (55.4 mM). B: examples of cytosolic Ca2+ levels to 1 min H2O2 (200 µM). Note the variable timing of peak responses (dashed lines). C: peristimulus time histogram grouping response timings to high K+ (responders to 55.4 mM; n = 22) and H2O2 (responders to 200 µM; n = 31; 30-s bins are shown. D: change from baseline for vehicle (n = 21), H2O2 (n = 31), and high K+ (n = 22). *P ≤ 0.05 vs. vehicle by one-way ANOVA on ranks. E: percent responders to different H2O2 concentration. Total number of cells tested: vehicle = 21, 100 µM = 22, 200 µM = 58, 300 µM = 28, and 500 µM = 15. *P ≤ 0.05 vs. vehicle by one-way ANOVA.

