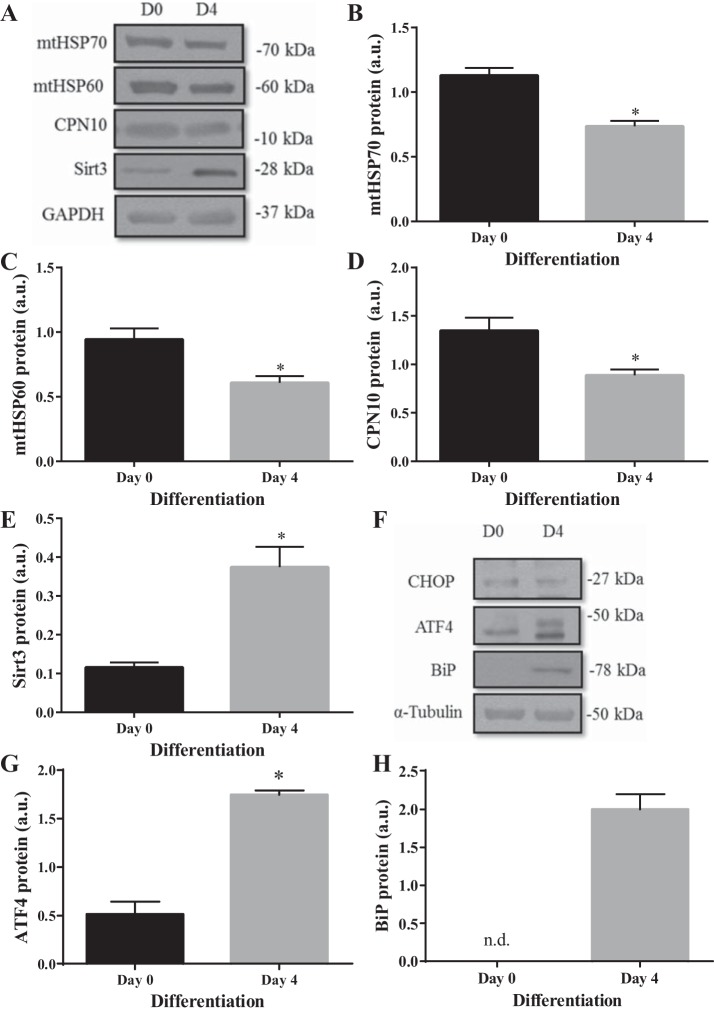
Fig. 2.
Skeletal muscle differentiation induces ER stress, while the UPRMT is largely inactivated. A: representative Western blots of UPRMT markers. Graphical quantifications of muscle cells during differentiation on days (D) 0 and 4: mtHSP70 (B), mtHSP60 (C), CPN10 (D), and Sirt3 (E). F: representative blots of UPRER markers. Graphical quantification of ATF4 (G) and BiP (H). Data are represented as means ± SE and are measured in arbitrary units (AU). *P < 0.05 vs. day 0; n = 3 experiments. n.d., not detectable.

