Fig. 2.
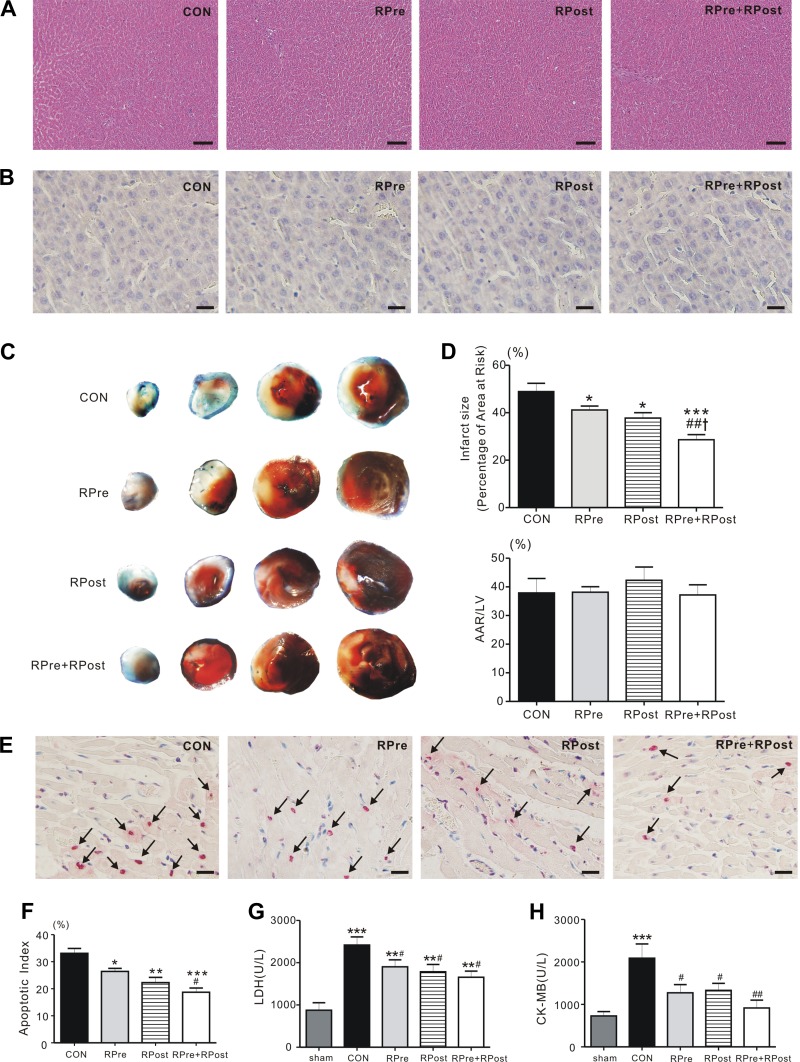
Liver conditioning ameliorated myocardial damage post reperfusion. A: hepatic ischemia and reperfusion cycles did not cause liver damage. Representative (of n = 5 rats/group) hematoxylin-and-eosin-stained micrographs of liver section are shown. Scale bars, 100 μm. B: representative images of terminal transferase dUTP nick-end labeling (TUNEL)-stained liver sections. Nuclei were counterstained with 3,3-diaminobenzene (n = 4–5). RPre, remote liver ischemic preconditioning; RPost, remote liver ischemic postconditioning; RPre+RPost, the combination of remote liver ischemic preconditioning and postconditioning. Scale bars, 10 μm. C: representative sections of triphenyltetrazolium chloride (TTC)-stained heart subjected to 45-min myocardial ischemia followed by 3-h reperfusion. CON, control; RPre, remote liver ischemia preconditioning; RPost, remote liver ischemia postconditioning; RPre+RPost, the combination of remote liver ischemia preconditioning with remote liver ischemic postconditioning. D: quantification of myocardial infarct size expressed as a percentage of left ventricular (LV) area at risk (AAR) (top) and AAR expressed as a percentage of LV area (bottom). Values are means ± SE; n = 5 each group. *P < 0.05 and ***P < 0.001 compared with CON; ##P < 0.01 compared with RPre; and †P < 0.05 compared with RPost (by one-way ANOVA). E: representative images of TUNEL-stained heart sections. Myocardial apoptosis was determined by measurement of TUNEL-positive cardiomyocyte nuclei in the AAR of myocardium obtained from liver-conditioned and CON rats after coronary artery reperfusion injury. TUNEL-positive (red) cardiomyocytes were identified as apoptotic cells. Positive cells were not detected in the nonischemic zone. Arrows denote TUNEL-positive nucleus. Scale bars = 10 μm. F: bar graph showing the TUNEL-positive nuclei expressed as a percentage of total nuclei in the heart AAR sections. Values are means ± SE; each group, n = 4–6. *P < 0.05, **P < 0.01, and ***P < 0.001 compared with CON; #P < 0.05 compared with RPre (by one-way ANOVA). G: serum levels of lactate dehydrogenase (LDH) in rats subjected to 45 min of left anterior descending artery occlusion followed by 3 h of reperfusion. Values are means ± SE; n = 11–13 per group. **P < 0.01 and ***P < 0.001 vs. sham; #P < 0.05 vs. CON. H: post-reperfusion injury mean serum levels of creatine kinase MB (CK-MB) for CON and liver ischemic conditioned rats. Values are means ± SE; n = 7–12 per group. ***P < 0.001 vs. sham; #P < 0.05 and ##P < 0.01 vs. CON.

