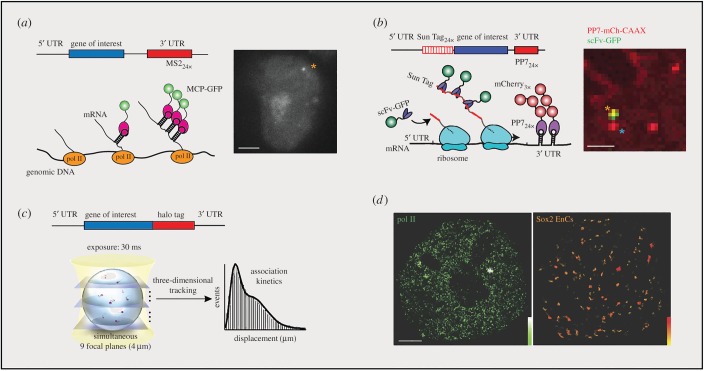
Figure 1.
Single-molecule imaging reveals profound stochasticity in fundamental gene regulatory steps. (a) MS2 system used for imaging transcriptional bursting. A cassette of MS2 repeats was inserted into 3′ UTR of the gene of interest. When transcribed, the MS2 sequence forms stem loops that are bound by the fluorescent coat protein MCP-GFP. Yellow asterisk indicates the genomic locus of the labelled gene under transcription. (b) SunTag system used for imaging translational bursting. A reporter gene fused with a DNA fragment encoding 24 SunTag peptides is introduced into the cell, along with a second construct expressing a GFP-tagged single-chain intracellular antibody (scFv-GFP) that binds to the SunTag peptide with high affinity. In parallel, the transcribed mRNA molecules are labelled with the PP7 system (PP7-mCh-CAAX), which is fused to the mCherry fluorescent protein and also incorporates a plasma membrane-tethering domain (CAAX). Asterisks mark single mRNA molecules that are undergoing translation (yellow) or not (blue). (c) Fast three-dimensional tracking of TF movement by simultaneous multifocus microscopy (MFM). The displacement of moving single molecules is plotted as a histogram. (d) Live-cell two-dimensional single-molecule tracking reveals Pol II clusters (Dendra 2-Pol II, left) and Sox2 enhancer clusters (Sox2-Halo, right). The colour map marks local density. All scale bars, 2 µm. With permission, (b) is modified from reference [17], (c) is modified from [8] and (d) is modified from [18].

