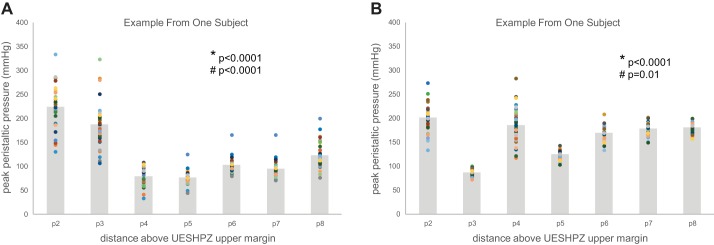
Fig. 2.
A: scattergram of site-specific peak peristaltic pressure at 2–8 cm proximal to the UESHPZ during swallowing 0.5 ml of water in a single subject. Scattergram points represent sitewise peak pressure in 40 swallows, and shaded bars represent the sitewise mean for all 40 swallows. There was significant variation in the mean peak peristaltic pressure value across the sites (*P < 0.0001) as well as significant variability within the data at each site (#P < 0.0001). Multiple sitewise comparisons showed that sites p4 and p5 were consistently different than all other peak pressure site measurements. B: scattergram of site-specific peak peristaltic pressure at 2–8 cm proximal to the UESHPZ during swallowing 0.5ml of water in a single subject. Scattergram points represent site-wise peak pressure in 40 swallows and gray boxes represent the site-wise mean for all 40 swallows. There was significant variation in the mean peak peristaltic pressure value across the sites (*P < 0.0001) as well as significant variability within the data at each site (#P < 0.01). Multiple sitewise comparisons showed that site p3 was consistently different than all other peak pressure site measurements. Also, within-site variability was inconsistent across sites.

