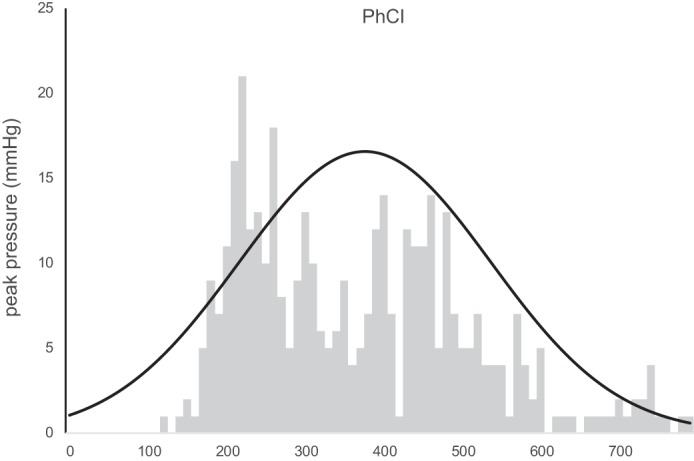
Fig. 6.

Distribution of the pharyngeal contractile integral (PhCI) data for 400 swallows in all subjects. These data showed normal distributions within 80% of subjects; however, the groupwise frequency plot shows a nonnormal distribution that is markedly skewed right, indicating the chance of measuring high values for PhCI within and among healthy subjects.
