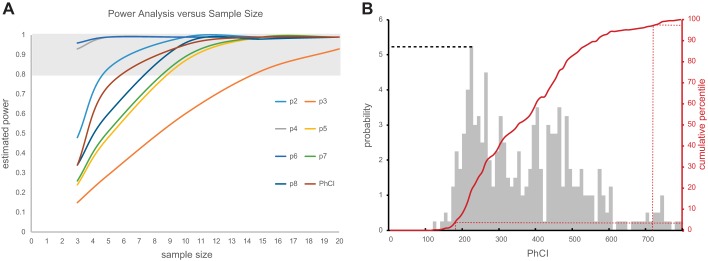
Fig. 7.
A: power analysis showing the relationship between sample size and power for sitewise peak peristaltic pressure and PhCI metrics. As seen for each metric, there is an associated curve relating sample size to estimated statistical power. Because a value of 0.8 is commonly accepted as an adequate threshold for acceptable statistical power, the shaded region of the graph delineates the point on each curve where adequate power is achieved. For example, adequate power for comparing means for p2 data would require at least 4 or 5 samples, whereas p3 data comparisons would require sample sizes of at least 14 or 15 samples. B: probability histogram and cumulative distribution are shown for all our PhCI data. The PhCI ranges are shown on the x-axis, and the probabilities are scaled on the left y-axis; for example, the probability of observing a PhCI of 220 is 5.25% as shown by the dashed line. The cumulative distribution function (CDF) is scaled by the right y-axis and red line. The CDF approach is useful in determining the overall probability of observing PhCI values less than, greater than, or within a range of PhCI values. For example, if one wanted to know the 95% confidence interval of the data collection, all the observations on the CDF between 2.5 and 97.5% of the population would indicate the values of PhCI between which 95% of the observations were seen. From B, this is shown as PhCI values between 170 and 720 as indicated by the dashed red lines.

