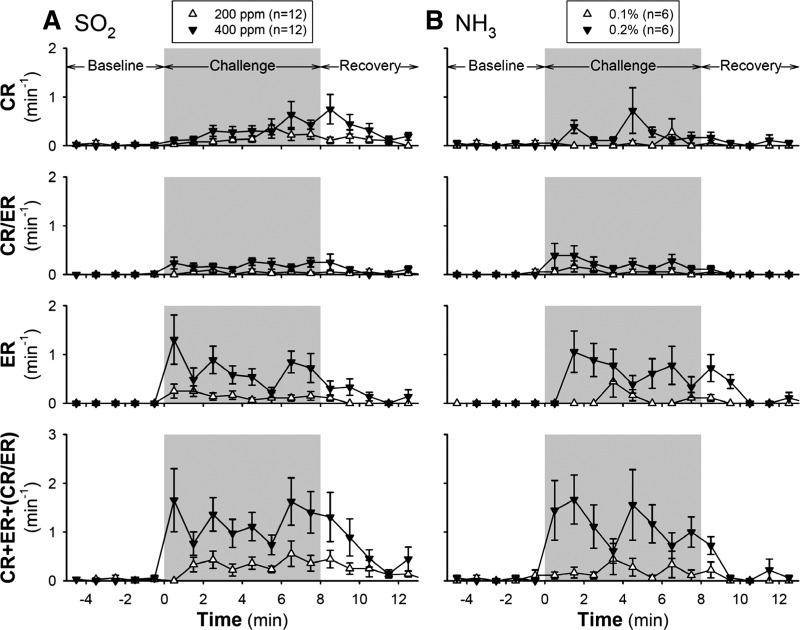
Fig. 3.
Changes in frequencies of CR and ER in response to inhalation challenges of SO2 (A) and NH3 (B) during control (before ovalbumin sensitization or vehicle treatment). CR/ER represented the response that could not be distinguished between CR and ER. Responses were recorded for 5 min before (baseline), 8 min during (gray shaded areas), and 5 min after the inhalation challenge (recovery). Responses to both low and high concentrations of each of the irritant gases (SO2: 200 ppm and 400 ppm; NH3: 0.1% and 0.2%) were tested, and at least 30 min elapsed between two consecutive challenges. Each test was repeated on three consecutive days in each mouse, and the data were averaged. Each data point represents the mean ± SE of all the animals tested.

