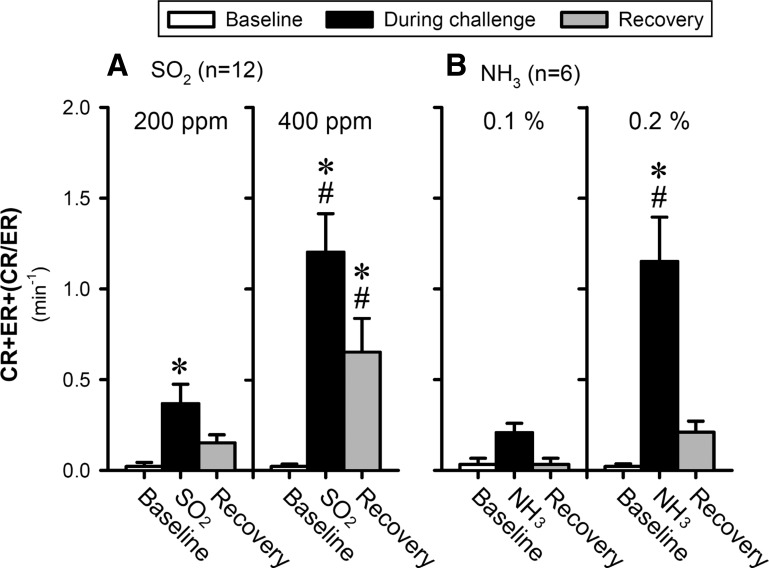
Fig. 4.
Group data of total cough responses (CR+ER+CR/ER) to inhalation challenges of SO2 (A) and NH3 (B) during control (before ovalbumin sensitization or vehicle treatment). Data (means ± SE) represent the group responses averaged over the 5-, 8- and 5-min durations of baseline, during challenge, and recovery, respectively; for details, see legend of Fig. 3. *Significantly (P < 0.05) different from the baseline data. #Significantly (P < 0.05) different from the responses to the low-concentration challenge.

