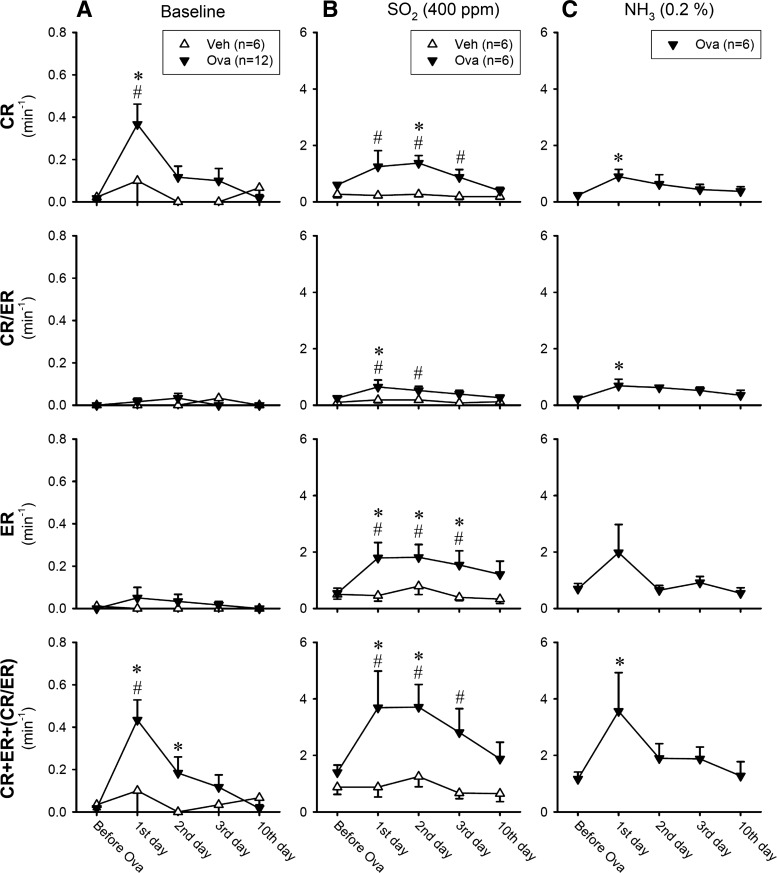
Fig. 6.
Effects of Ova sensitization and Veh treatment on the frequencies of cough reflex (CR) and expiration reflex (ER) in response to inhalation challenges of SO2 and NH3 at different time points after the treatment. CR/ER represented the response that could not be distinguished between CR and ER. A: baseline cough frequency averaged over the 5-min duration immediately before the irritant gas inhalation challenge. B and C: cough responses to SO2 (400 ppm) and NH3 (0.2%) inhalation challenges, respectively, averaged over the 8-min duration. In A, n = 12 in the Ova-sensitized group and n = 6 in the Veh-treated group; this difference is due to the fact that the response to NH3 was not tested in the Veh group (C). Each data point represents the mean ± SE. *Significantly (P < 0.05) different from the data obtained before Ova sensitization or Veh treatment. #Significantly (P < 0.05) different from the corresponding data point in the Veh group.

