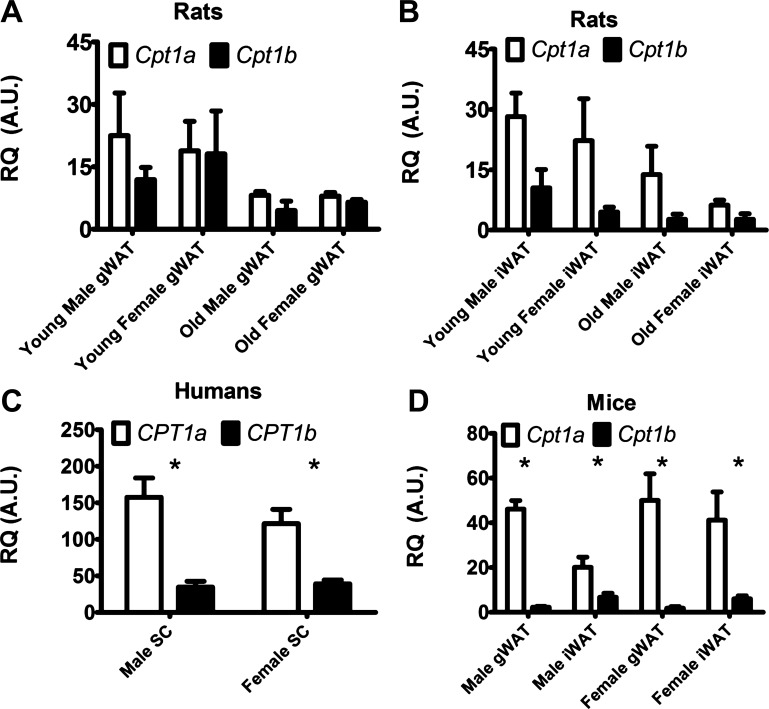
Fig. 2.
Quantitative PCR results showing relative mRNA expression of Cpt1a (white bars), and Cpt1b (black bars). A: relative expression of Cpt1 isoforms in rat gWAT. B: relative expression of Cpt1 isoforms in rat iWAT. Young rats were 8–10 wk of age, old rats were 24 wk of age. C: relative expression of CPT1 isoforms in human subcutaneous fat. D: relative expression of Cpt1 isoforms in 8- to 10-wk-old mouse WAT depots. SC, subcutaneous for humans; gWAT, gonadal WAT; iWAT, inguinal WAT; n = 6 for all mice and rat data; n = 3 men and n = 11 women. Values are means ± SE; *P < 0.05.

