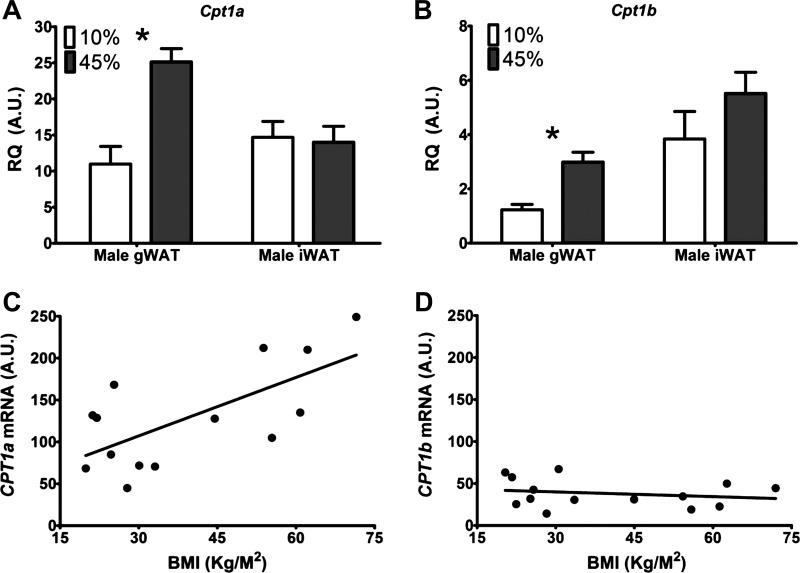
Fig. 3.
Change in Cpt1 mRNA expression levels with diet and body mass index (BMI). Cpt1a (A) and Cpt1b (B) expression levels in WAT depots of mice fed a diet with 10% (white) or 45% (gray) fat for ~40 wk. Values are means ± SE; *P < 0.05 between Cpt1 isoform expression levels. n = 7 animals given low-fat diet, n = 11 animals given high-fat diet. C: correlation between CPT1a levels in human adipose tissue and BMI (R = 0.46). D: correlation between CPT1b levels in human adipose tissue and BMI (R = 0.04).

