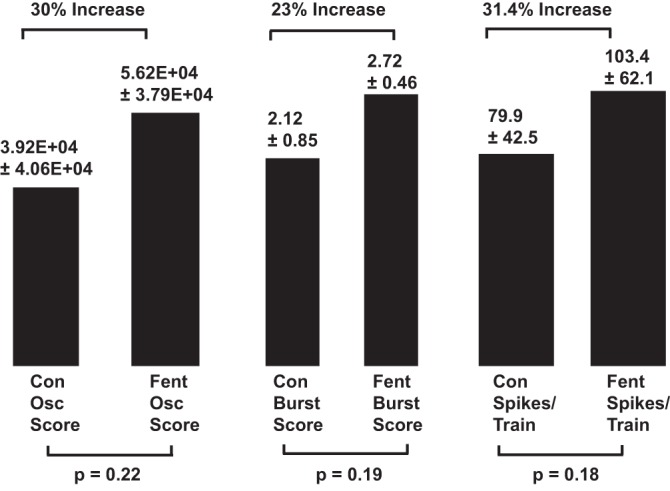
Fig. 9.

Histograms summarizing the effects of threshold doses of fentanyl (Fent) on oscillation (Osc) intensity, burst intensity, and action potentials/train based on pooled data from all ventral respiratory column (VRC) neurons (n = 22). Mean and standard error values for the control (Con) and fentanyl measurements are positioned above each histogram, along with changes produced by fentanyl. Significance of differences between control and fentanyl means is entered below each bar.
