
Fig. 10.
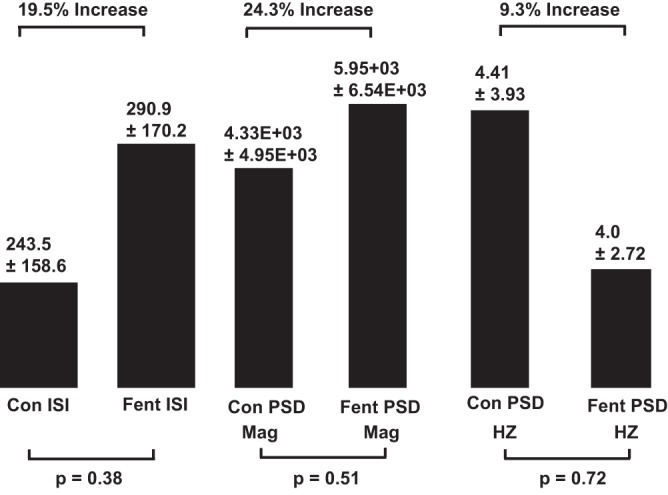
Histogram summarization of the effects of threshold fentanyl doses on interspike intervals (ISI), power spectral density (PSD), magnitude (Mag), and peak frequency (Hz) on all VRC neurons. Refer to the Fig. 9 legend for details.
Official websites use .gov
A
.gov website belongs to an official
government organization in the United States.
Secure .gov websites use HTTPS
A lock (
) or https:// means you've safely
connected to the .gov website. Share sensitive
information only on official, secure websites.
Histogram summarization of the effects of threshold fentanyl doses on interspike intervals (ISI), power spectral density (PSD), magnitude (Mag), and peak frequency (Hz) on all VRC neurons. Refer to the Fig. 9 legend for details.