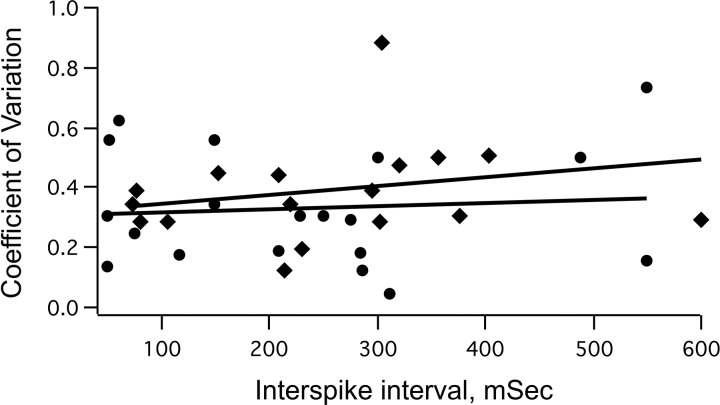
Fig. 11.
Coefficients of variation plotted against interspike intervals for all VRC neurons (n = 22). Circles with the line of best fit are taken from control measurements before fentanyl administration. Diamonds with the best-fit line are from fentanyl measurements made after injecting threshold doses of fentanyl.

