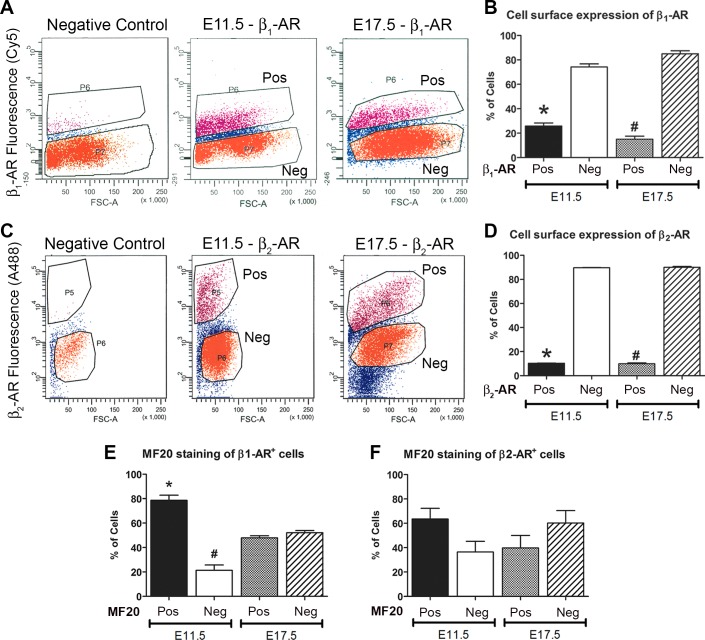
Fig. 2.
Characterization of cell surface expression of β1- and β2-ARs in embryonic ventricular cells. A and C: scatterplots of FACS-sorted E11.5 and E17.5 ventricular cells stained with extracellular domain-specific β1-AR (A) or β2-AR (C) antibodies. Negative control represents unstained E11.5 cells lacking the β1-AR antibody (A) or β2-AR antibody (C). B and D: relative distribution of β1-AR (B) or β2-AR (D) positive (Pos) and negative (Neg) cells in E11.5 and E17.5 ventricular cell preparations. B: *P < 0.005, E11.5 β1-AR Pos vs. E11.5 β1-AR Neg and E17.5 β1-AR Neg; #P < 0.005, E17.5 β2-AR Pos vs. E17.5 β2-AR Neg and E11.5 β2-AR Neg; D: *P < 0.005, E11.5 β2-AR Pos vs. E11.5 β2-AR Neg; #P < 0.005, E17.5 β2-AR Pos vs. E17.5 β2-AR Neg. E and F: relative distribution of MF20 Pos and Neg cells in β1-AR Pos (E; *P < 0.005, E11.5 β1-AR Pos/MF20 Pos vs. all other groups; #P < 0.05 E11.5 β1-AR Pos/MF20 Neg vs. all other groups) or β2-AR Pos (F) FACS-sorted cell fractions from E11.5 and E17.5 ventricular cells. In B and D–F, one-way ANOVA, Tukey’s multiple-comparisons test. Each bar represents means ± SE, n = 3 independent experiments.

