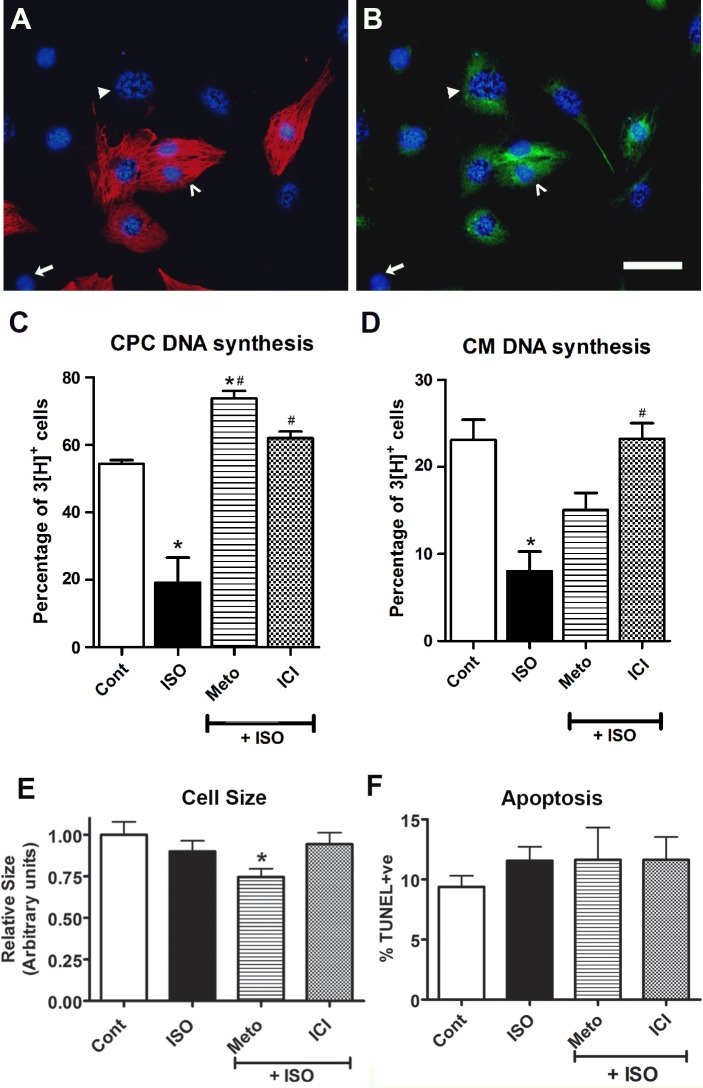
Fig. 5.
Assessment of DNA synthesis, cell size, and apoptosis levels in E11.5 ventricular cells in response to β-AR stimulation and inhibition. A and B: ventricular cells generated from double knockin embryos (Nkx2.5-Cre × Rosa-lacZ) were processed for [3H]thymidine incorporation assay. A: cells were labeled for sarcomeric myosin (MF20; red) and nuclei (Hoechst; blue). B: the same field of cells was also colabeled with β-galactosidase antibodies (β-Gal; green). Cells positive for MF20 and β-Gal (β-Gal+/MF20+) are mature cardiomyocytes (CMs; open arrowhead), whereas cells positive for β-Gal only (β-Gal+/MF20−) are cardiac progenitor cells (CPCs; solid arrowhead) and cells negative for both β-Gal and MF20 (β-Gal−/MF20−) are noncardiomyogenic cells (arrow). The CPC indicated by the solid arrowhead is also [3H]+ based on the presence of silver grains in the nucleus. Bar = 100 µm in A and B. C and D: quantification of cells undergoing DNA synthesis in CPC (C) and CM (D) populations after treatment with the indicated drugs: ISO (1 µM), Meto (1 µM), or ICI (1 µM). *P < 0.05 vs. control (Cont); #P < 0.05 vs. ISO alone, one-way ANOVA, Tukey’s multiple-comparisons test. Each bar represents means ± SE; n = 5 independent experiments. E and F: quantification of CM cell size (E) and apoptosis (F) levels after treatment with indicated drugs. *P < 0.05 vs. control, one-way ANOVA, Tukey’s multiple-comparisons test. Bars represent means ± SE; n = 3 independent experiments.

