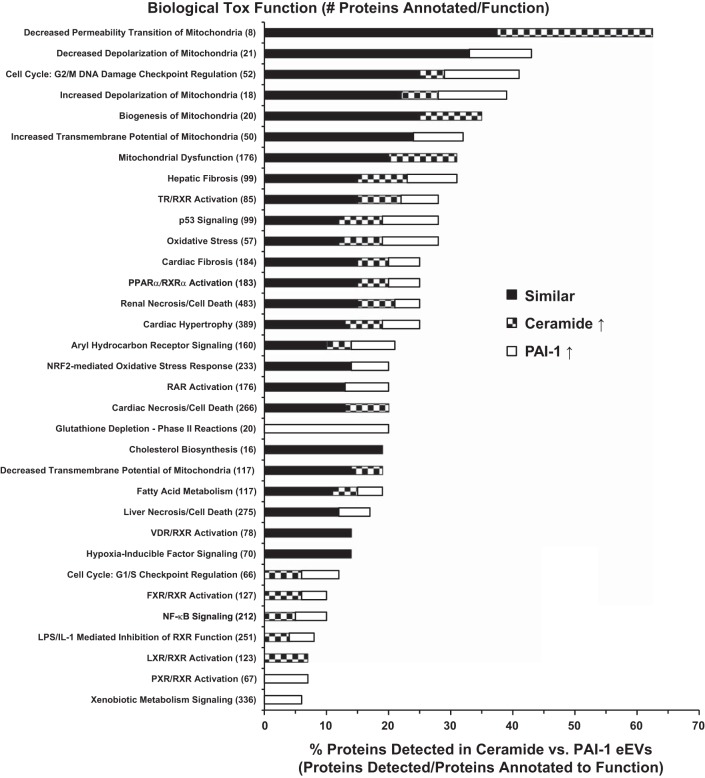
Fig. 3.
Comparison of the top biological toxicology functions of proteins identified in ceramide vs. PAI-1 eEVs. Bottom axis indicates the percentage of proteins from the eEV data set attributed to that particular “Biological Tox Function” (detected proteins/total annotated to the particular function). Proteins not significantly different between ceramide and PAI-1 eEVs (black) and those significantly increased in ceramide (checkered) or significantly increased in PAI-1 (white) eEVs are indicated.

