Fig. 2.
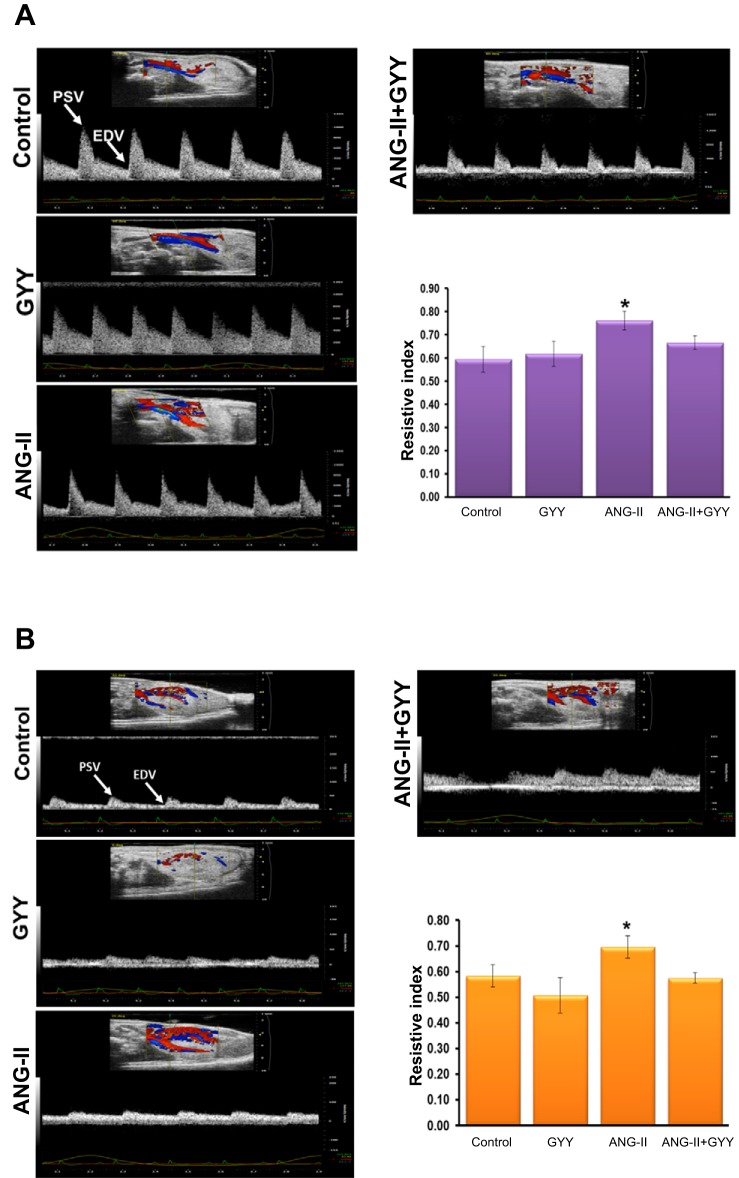
Renal arterial and cortical resistive indices are increased in hypertensive kidney. A and B: ultrasound analysis of the renal artery (A) and cortex (B) showing the resistive index in mice treated with ANG II and GYY. The bar graph represents the mean resistive index ± SD. n = 5 mice/group. *P < 0.05.

