Fig. 4.
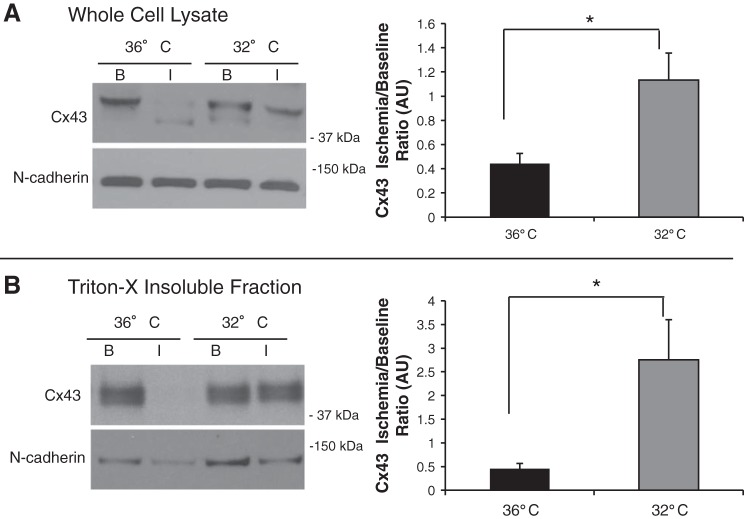
MH attenuates ischemia-induced total and ID Cx43 protein expression. A: total Cx43 protein expression. Left, representative Western blot analysis under CT baseline and 30 min of ischemia (36° B and 36° I) and MH baseline and 30 min of ischemia (32° B and 32° I). Right, summary data for the Cx43 ischemia-to-baseline ratio (CT: n = 8 and MH: n = 10). During ischemia, there was decrease in total Cx43 expression versus baseline at 36°C (*P = 0.002). During ischemia, MH attenuated the ischemia-induced total Cx43 reduction (P = 0.018 vs. CT). B: Triton-X-insoluble “ID” Cx43 expression. Left, representative example of ID expression in 36° B, 36° I, 32° B, and 32° I groups. Right, summary data (CT: n = 7 and MH: n = 7). No difference was seen at baseline in ID Cx43. MH attenuated the ischemia-induced ID Cx43 reduction (P = 0.020 vs. CT).

