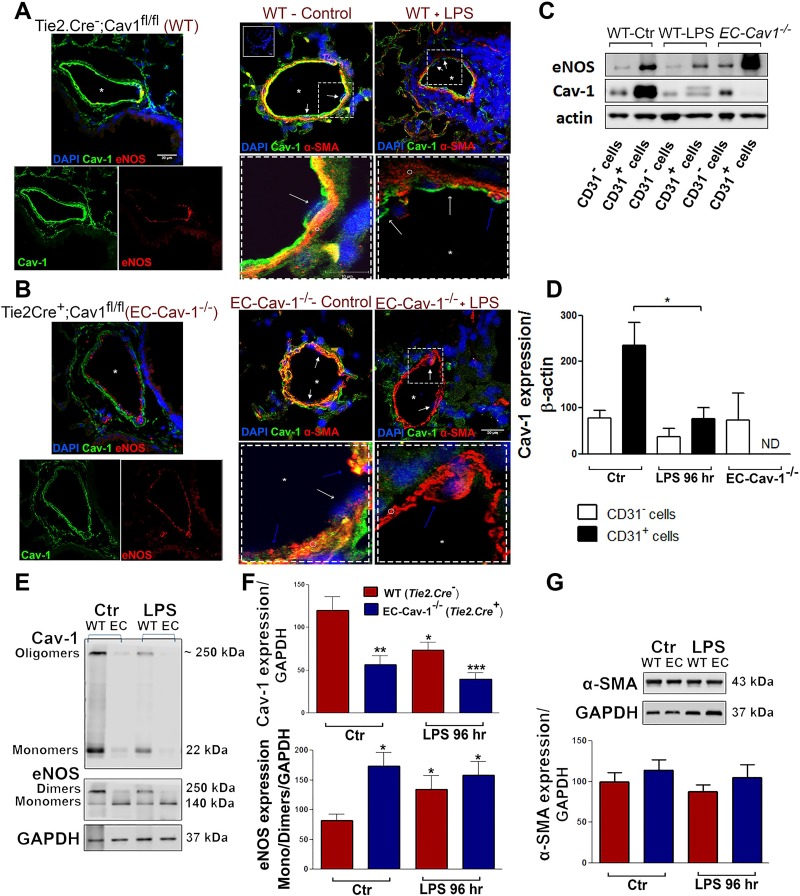
Fig. 2.
LPS induced Cav-1 depletion and endothelial nitric oxide synthase (eNOS) uncoupling in pulmonary vasculature. Lung sections from WT (Tie2.Cre−;Cav1fl/fl mice) (A) and endothelial cell (EC) Cav-1−/− (Tie2.Cre+;Cav1fl/fl mice) (B) exposed to saline (control) or LPS for 96 h (LPS). The panels at left show Cav-1 (green) or eNOS (red) expression in the control groups (top = merged channels; bottom = split channels). The panels at right show Cav-1 (green) and α-SMA (red) expression in vehicle and LPS-treated WT (inset = negative control) and EC Cav-1−/− mice (top = 20 µm; dashed squares = 10 µm). Symbols indicate endothelial cells (white arrows), α-smooth muscle actin+ cells (blue arrows or ○), and vascular lumen (*). Nuclei were stained with DAPI. C: mouse lungs from vehicle-treated WT (control), 96-h LPS-treated WT mice, and EC Cav-1−/− were digested to obtain freshly isolated CD31 positive and negative cells (CD31+ or CD31−). EC lysates were used for Western blot analysis of Cav-1 and eNOS expression. D: densitometry of Cav-1 and eNOS expression (n = 3 animals/group). E: Western blots showing Cav-1 and eNOS expression in total lung lysates. F: densitometry of Cav-1 and eNOS expression in lung lysates. G: Western blot showing α-SMA expression in total lung lysates. *P < 0.05, **P < 0.01, and ***P < 0.001 vs. WT control (CD31+ cells or total lungs) by one-way ANOVA followed by post hoc Newman-Keuls test (n = 4 animals/group).

