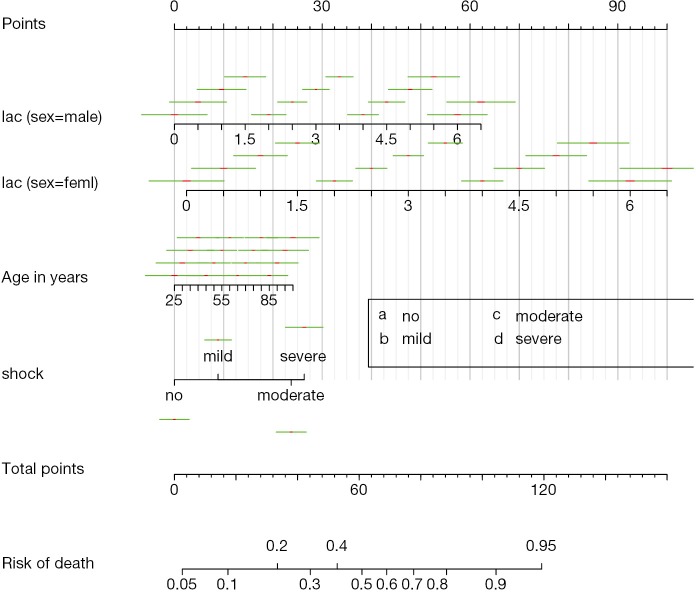
Figure 1.
Nomogram for ordinal outcome variable y. Each predictor with a given value can be mapped to the Points axis. The sum of these points can be referred to in the Total Points axis. Then the linear predictor and the probability of death can be obtained from corresponding axis. The green bar indicates the 0.7 confidence limits for each score, and the short red bar corresponds to 0.1 confidence limits. The legend is for abbreviations of categorical variable shock. However, this version of nomogram() does not abbreviate levels of factor variables, but it is supposed to abbreviate levels of categorical factors to letters of the alphabet for tick marks when we set minlength=1.

