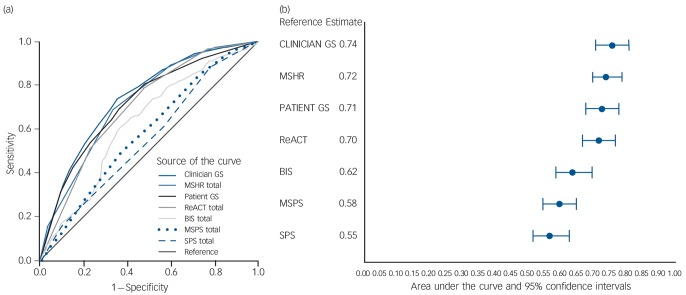
Fig. 1.
The receiver operator characteristic curves (a) show the relationship between the proportion of true positives (sensitivity) and the proportion of false positives for the seven scales. The forest plot (b) shows the area under the curve estimates and 95% confidence intervals for the scales.
Clinician GS, clinician global scale; MSHR, Manchester Self-Harm Rule; Patient GS, patient global scale; ReACT, ReACT Self-Harm Rule; BIS, Barratt Impulsiveness Scale; MSPS, Modified SAD PERSONS Scale; SPS, SAD PERSONS Scale.

