
Figure 2. Electroretinogram recordings of average rod photovoltage in darkness and following pigment bleaching.
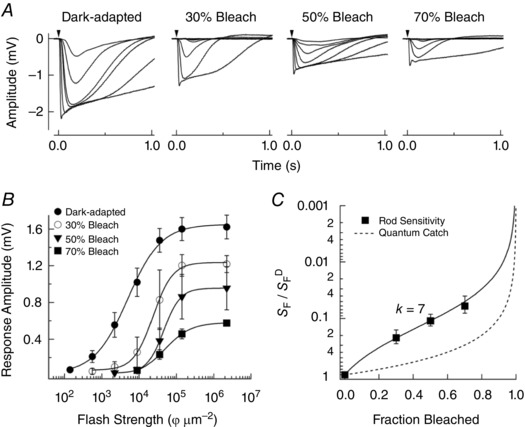
A, pharmacologically isolated ERG a‐waves measured from whole‐mount retinas of Gnat2−/− mice in darkness (n = 6) and 1 h after 30% (n = 4), 50% (n = 7) and 70% (n = 7) bleaching of the visual pigment (see Methods). Responses in darkness and after bleaching were from the same retina. Flashes at the time indicated by the downward arrow delivered 140–35 000 photons μm−2 in darkness, 550–35 000 photons μm−2 after the 30% bleach, and 2200–140 000 photons μm−2 after the 50% and 70% bleaches. B, response versus flash strength relationships for response families shown in A for the same retina in darkness and after bleaching. The sensitivity of rod photoresponses was determined from the flash strength that yielded a half‐maximal response. C, the sensitivity following pigment bleaching (S F), relative to the sensitivity in darkness (S F D), plotted versus the fraction of the visual pigment bleached and fitted as in Fig. 1. The fit line is a Weber–Fechner relationship with k = 7.