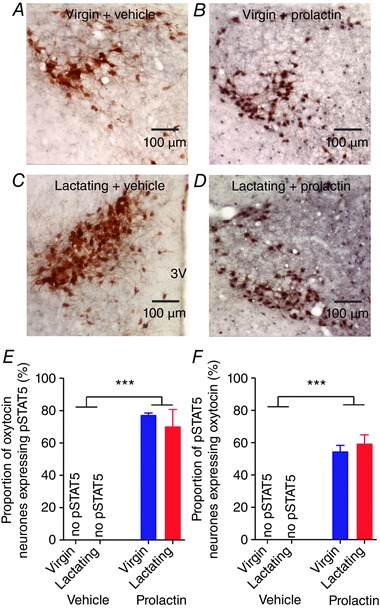
Figure 8. Prolactin activates pSTAT5 in the paraventricular nucleus of virgin and lactating rats.

A–D, representative images of pSTAT5 (nuclear staining) and oxytocin immunostaining (cytoplasmic staining) in the paraventricular nucleus of virgin and lactating rats after three injections of bromocriptine over 28–4 h before the experiment. E, mean (±SEM) proportion of oxytocin neurones expressing pSTAT5 in the paraventricular nucleus of virgin and lactating rats given either i.c.v. vehicle (n = 5 and 4, respectively) or 500 ng prolactin (n = 7 and 6, respectively) after three injections of bromocriptine over 28–4 h before the experiment. Two‐way ANOVA: main effect of reproductive status: F 1,21 = 0.27, P = 0.61; main effect of prolactin: F 1,21 = 118.78, P < 0.001; interaction: F 1,21 = 0.27, P = 0.61. F, mean (±SEM) proportion of pSTAT5‐positive neurones expressing oxytocin in the paraventricular nucleus of virgin and lactating rats given either i.c.v. vehicle (n = 5 and 4, respectively) or 500 ng prolactin (n = 7 and 6, respectively) after three injections of bromocriptine over 28–4 h before the experiment. Two‐way ANOVA: main effect of reproductive status: F 1,21 = 2.28, P = 0.60; main effect of prolactin: F 1,21 = 155.90, P < 0.001; interaction: F 1,21 = 2.28, P = 0.60. 3V: 3rd ventricle. [Color figure can be viewed at wileyonlinelibrary.com]
