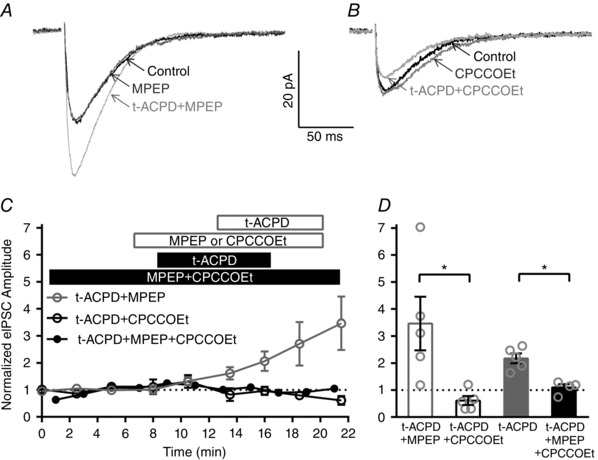
Figure 2. IHC efferent eIPSC amplitudes are specifically enhanced by activation of mGluR1.

A, averaged eIPSCs from an individual IHC in control, mGluR5 antagonist (MPEP; 8 min), and mGluR5 antagonist with the general mGluR agonist (t‐ACPD; 16 min). B, averaged eIPSCs from an individual IHC in control (average of first files), mGluR1 antagonist (CPCCOEt; 8 min), and mGluR1 antagonist with the general mGluR agonist (t‐ACPD; 13.5 min). C, normalized eIPSC amplitudes across IHCs before, during and after general mGluR agonist (t‐ACPD) application in the presence of either the mGluR5 antagonist alone (MPEP, grey open circles), the mGluR1 antagonist alone (CPCCOEt, black open circles), or both antagonists (MPEP + CPCCOEt, black filled circles). D, a significant decrease in the mean normalized eIPSC amplitude is observed during either application of the mGluR1 antagonist alone (CPCCOEt, 9.5 min after t‐ACPD agonist application, filled grey bar) or application of both mGluR5 and mGluR1 antagonists (MPEP + CPCCOEt, 7 min after t‐ACPD agonist application, black filled bar) compared to application of the mGluR5 antagonist alone (MPEP, 9.5 min after t‐ACPD agonist application, grey open bar).
