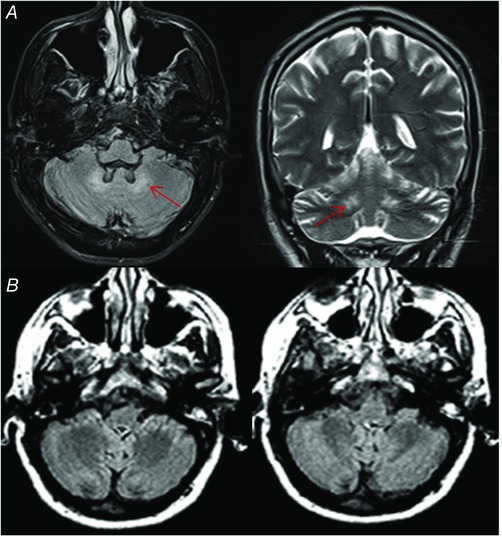
Figure 1. Brain MRI.

A, brain MR of patient 3 showing presence of bilateral DN hyperintensity (arrows) on axial FLAIR image (left) and coronal T2‐weighted image (right). B, brain MR of patient 14 showing absence of DN signal alteration on axial FLAIR images. [Color figure can be viewed at wileyonlinelibrary.com]
