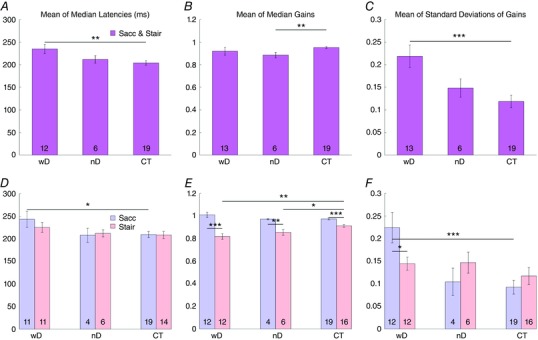
Figure 4. Latency, gain and precision of visually guided saccades.

Bar graphs of the mean values of latency, gain and precision of horizontal visually guided saccades of CTX patients with DN involvement (wD), CTX patients without DN involvement (nD) and controls (CT). A–C, mean values of single‐step and multistep saccades pooled together. D–F, blue bars indicate the mean values of the single‐step saccades (Sacc); pink bars represent the mean values of the multistep saccades (Stair). Asterisks indicate the significant differences among groups (P < 0.05). [Color figure can be viewed at wileyonlinelibrary.com]
