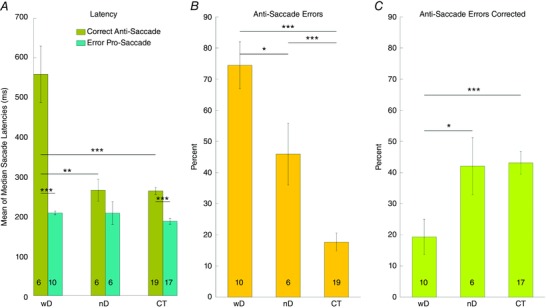
Figure 5. Latency, percentage of directional errors and corrections in the antisaccades task.

A, bar graphs of the mean latencies of correct antisaccades (olive) and erroneous prosaccades directed towards the target (teal) in CTXwD, CTXnD and CT. B, percentage of antisaccade errors (i.e. erroneous prosaccades). C, percentage of corrections after erroneous prosaccades (i.e. secondary corrective antisaccades). Asterisks indicate the significant differences among groups (P < 0.05). [Color figure can be viewed at wileyonlinelibrary.com]
