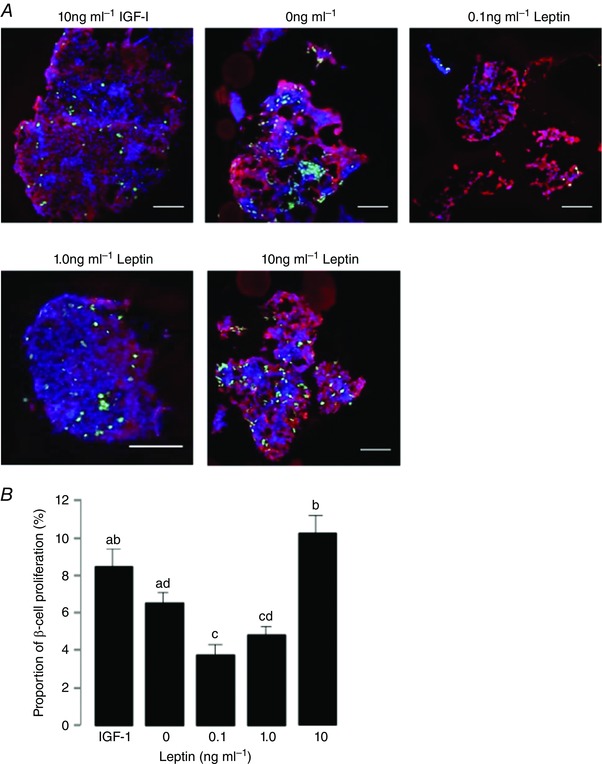
Figure 4. Beta cell proliferation in leptin treated islets.

A, immunofluorescent staining to show insulin (red), EdU (green) and DAPI (blue) in fetal ovine pancreatic islets cultured in 10 ng ml−1 IGF‐I (positive control) or 0, 0.1, 1.0 and 10 ng ml−1 leptin. Scale bar = 25 μm. B, mean (±SEM) proliferation rates in beta cells after incubation with increasing doses of leptin compared to 10 ng ml−1 IGF‐I. Values with different letters are significantly different from each other, one‐way ANOVA, P < 0.05.
