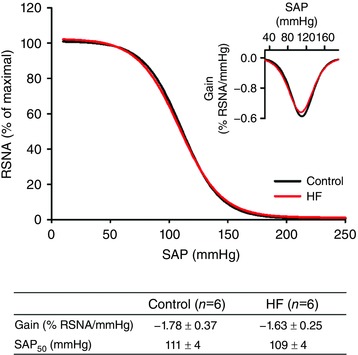
Figure 2. Mean baroreflex curves showing the relationship between SAP and RSNA fitted by a four‐parameters logistic sigmoidal regression.

The inset shows the first derivative of the sigmoidal regression, and the table shows the group values of the parameters extracted from the barocurves. HF: heart failure; Gain: minimum value of the first derivate of the sigmoidal function; SAP50: SAP at the midpoint of the curve; no significant differences were found between the groups. [Color figure can be viewed at wileyonlinelibrary.com]
