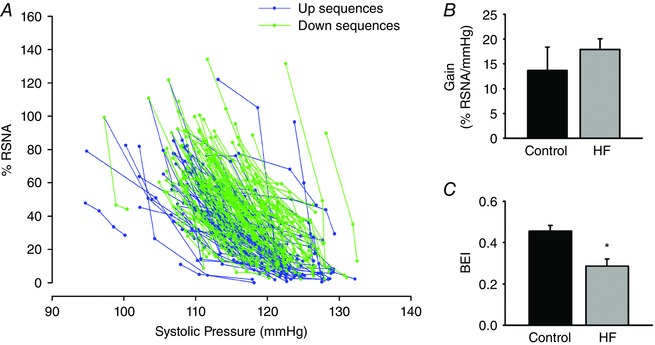
Figure 5. Representative baroreflex sequences and group data of gain and BEI, calculated with the sequence method, for delay 1.

A, representative example of baroreflex sequences calculated with the sequence method using the parameters set in the Methods section and delay 1. B and C show the values of gain and BEI, respectively, for the control (n = 6) and HF (n = 7) groups. HF: heart failure; * P < 0.05 compared with control group. [Color figure can be viewed at wileyonlinelibrary.com]
