
Figure 6. Effect of H2 relaxin on type I and II PVN neurons.
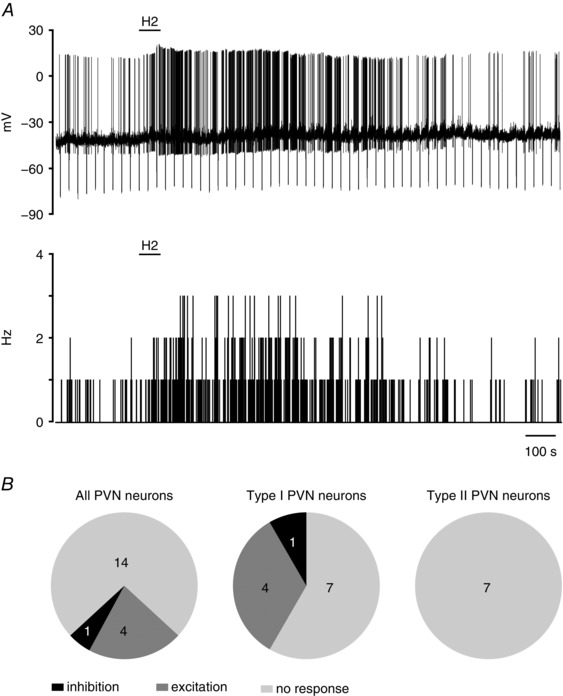
A, representative trace of a zero current‐clamp recording (upper) and corresponding activity histogram (lower; bin, 1 s) of a spontaneously active type I PVN neuron, illustrating the excitatory effect of H2 relaxin (H2; 600 nm; horizontal bar) in normal ACSF. B, pie charts representing the numbers of type I and II PVN neurons responding differentially to H2 relaxin application.