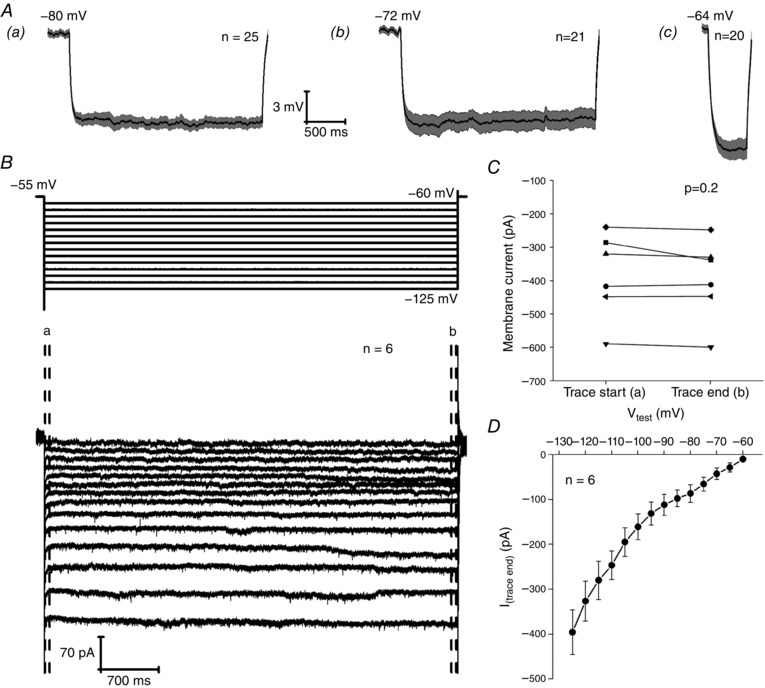
Figure 8. Absence of HCN channel‐like current.

Aa and Ab, average current clamp trace showing the response to a 2.5 s, 20 pA hyperpolarizing current injection applied to cells at a prestimulus potential of (Aa) −80 mV and (Ab) −72 mV. Ac, average current clamp trace showing the response to a 500 ms, 20 pA hyperpolarizing current injection applied to cells at a prestimulus potential of −64 mV. B, voltage clamp protocol (top) and resultant average traces (bottom) of a series of 5 mV hyperpolarizing steps from a holding potential of −55 mV. C, change in membrane current between the first 60 ms (Ca) and the final 60 ms (Ca) of a voltage step to −125 mV. D, average I–V of the current response during the final 60 ms of a 5 s test pulse for a series of 5 mV hyperpolarizing voltage steps applied to six neurons held at −55 mV.
