
Figure 9. AP production in response to depolarizing 500 ms ‘square‐wave’ current injections.
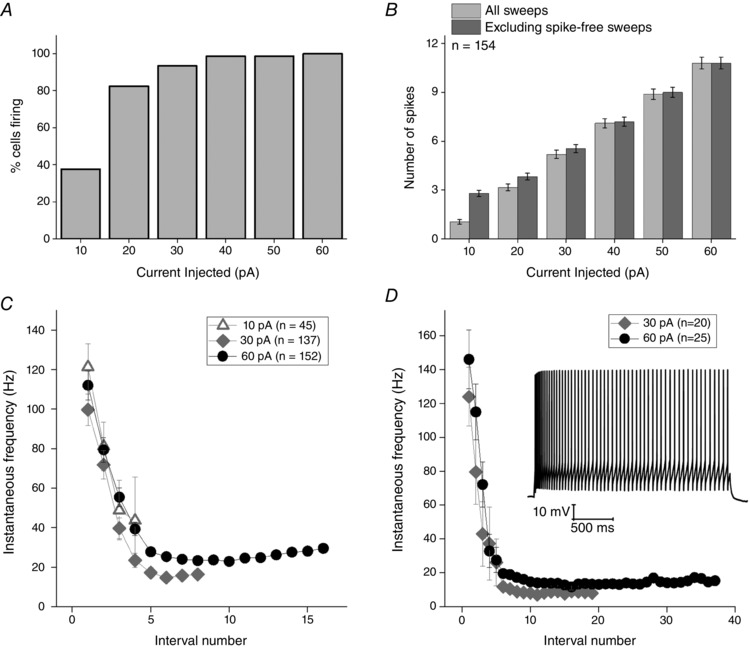
A, fraction of cells generating at least one AP and (B) the mean number of AP produced in response to a series of 6 incremental 500 ms depolarizing current injections (10–60 pA) from a set pre‐stimulus potential of −80 mV. C, instantaneous AP frequency vs. interval number for a 10, 30 and 60 pA, 500 ms current stimuli. D, instantaneous AP frequency vs. interval number and inset a sample voltage response, for a 30 and 60 pA, 2.5 s current stimuli. All error bars represent the SEM. All cells were set at −80 mV prior to current application.