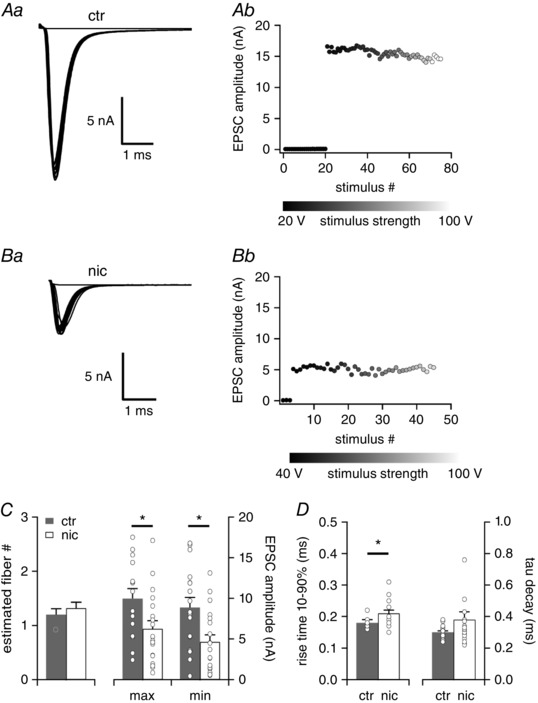
Figure 1. Excitatory postsynaptic currents are smaller in VNLL neurons of nicotine‐treated mice at P22.

Aa and b, EPSC traces evoked by increasing stimulus strength representative for P22 neurons of untreated (ctr) mice (a) and the corresponding EPSC amplitudes as a function of stimulus number (b). Ba and b, EPSC traces evoked by increasing stimulus strength representative for P22 neurons of nicotine‐treated (nic) mice (a) and the corresponding EPSC amplitudes as a function of stimulus number (b). All traces represent the average of at least three consecutive recordings. C, the estimated number of excitatory input fibres, the total maximal EPSC amplitude and the minimal EPSC amplitude are shown for ctr (n = 15, grey bars) and nic (n = 19, white bars) VNLL neurons. * P < 0.05, Student's unpaired t test. D, rise time 10–90% and tau decay of the average EPSC evoked by minimal stimulation for ctr (n = 17, grey bars) and nic (n = 19, white bars) mice. * P < 0.05, Mann‐Whitney U test.
