
Figure 3. Increase of sEPSC frequency but no change in release probability in nicotine‐treated animals.
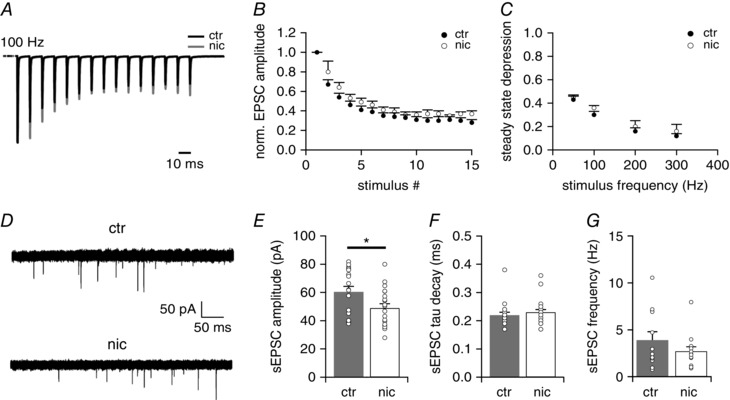
A, representative EPSC traces in response to 15 stimulations at 100 Hz for untreated (ctr; black trace) and nicotine‐treated (nic; grey trace) VNLL neurons. B, normalized EPSC amplitudes to 100 Hz stimulus frequency (ctr n = 6, nic n = 5). C, steady state depression of EPSCs in ctr and nic VNLL neurons as a function of stimulus frequency (ctr n = 6, nic n = 5). D, recording of sEPSCs from ctr (upper trace) and nic (bottom trace) VNLL neurons. E–G, sEPSC amplitude (E), sEPSC tau decay (F) and sEPSC frequency (G) of ctr and nic VNLL neurons (ctr n = 19, grey bars, nic n = 19, white bars). * P < 0.05, Mann‐Whitney U test.