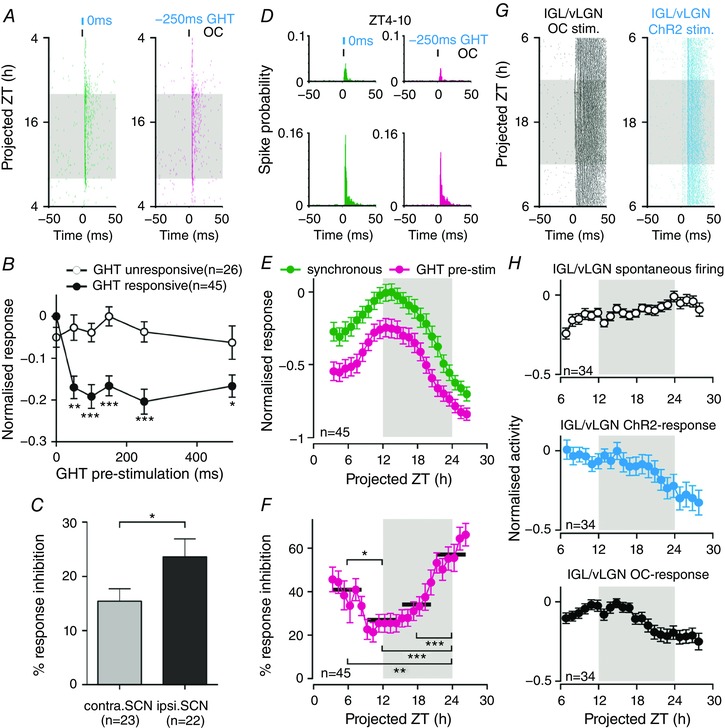
Figure 6. Geniculohypothalamic modulation of SCN responses to optic input.

A, perievent raster of SCN multi‐unit responses to electrical stimulation of the OC; synchronous with (left), or 250 ms after (right), optogenetic activation of GABAergic GHT projection neurons (for recording set‐up, see Fig. 5
F). B, normalized mean ± SEM OC‐driven responses of SCN subpopulations as a function of GHT pre‐stimulation latency: at most recording sites (n = 45/71 OC‐responsive sites from three slices; for classification details, see Methods), GHT pre‐stimulation evoked long‐lasting suppression of OC‐driven responses (two‐way RM ANOVA: GHT pre‐stimulation, Group and interaction, all P < 0.001; asterisks indicate significance differences between groups in Sidak's post hoc tests). C, GHT‐driven inhibition of OC‐evoked responses was significantly greater ipsilateral to the optogenetically stimulated LGN (n = 22 vs. n = 23 contralateral sites; t test, P < 0.05). D, perievent histograms of SCN responses (perievent rasters are depicted in A) showing enhanced OC‐driven responses during the late day/early projected evening. E, normalized mean ± SEM response of GHT‐responsive sites (n = 45) to OC‐stimulation: synchronous with ( ), or subsequent to (
 ), optical activation of GABAergic GHT projection neurons. In both cases, an F test indicated a significantly better fit to a sinusoidal (24 h) vs. linear function (both P < 0.001 where a linear process generated the data). F, GHT‐driven inhibition of OC‐evoked responses (data from E, expressed as a percentage of the response observed under synchronous stimulation) varies significantly across the 24 h in vitro recording period (one‐way RM ANOVA of 6 h binned data; P < 0.001; asterisks indicate significance differences between timepoints in Tukey's post‐hoc tests). G, perievent raster of IGL/vLGN multi‐unit responses to OC and optical stimulation (as in Fig. 5
C). H, normalized mean ± SEM IGL/vLGN population activity (n = 34 responding sites from three slices) under basal conditions (top), following direct ChR2 (middle) or OC stimulation (bottom). In none of the above cases did we observe evidence of pronounced day‐night variation (F test, all P = 0.999; which were more probably generated by a linear vs. sinusoidal model). Shaded areas in (A) and (E–H) represent projected night. In (B) and (F): *
P < 0.05, **
P < 0.01 and ***
P < 0.001, respectively.
