
Figure 2. Individual percentage changes in maximal power output (W max) after the second exercise training period for non‐responders in each group.
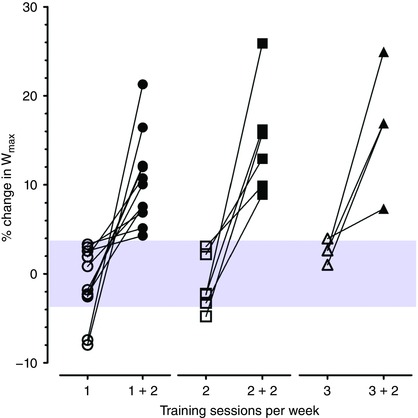
The typical error of measurement (%TE) for W max measurement is illustrated by the shaded area. Values within this area represent non‐response. Non‐response was abolished after the second exercise training period in all individuals. [Color figure can be viewed at wileyonlinelibrary.com]