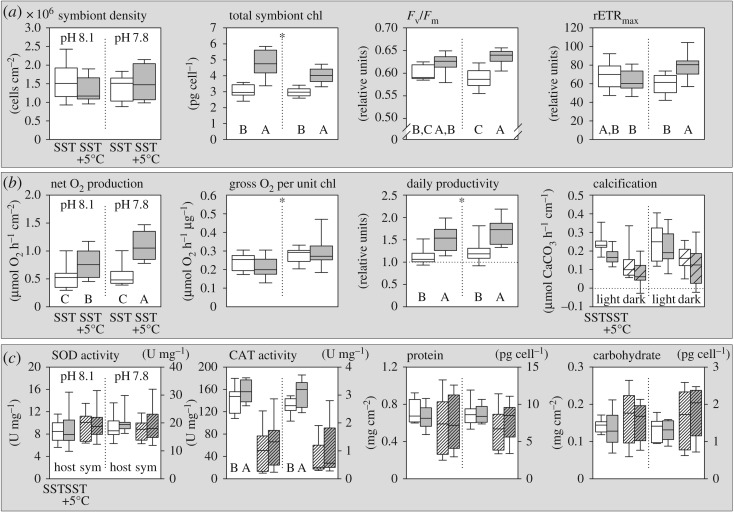
Figure 3.
Physiological response of Stylophora pistillata to elevated temperature and reduced pH. All graphs show responses to ambient (white) versus high temperatures (grey) under ambient (left side) and reduced pH conditions (right side), respectively. (a) Coral symbiont characteristics and photochemistry. (b) Coral productivity and calcification in the light (clear box) and dark (textured box). (c) Host (clear boxes, left axis) and symbiont (textured boxes, right axis) enzymatic antioxidant activity (normalized to protein) and total soluble protein and carbohydrate content. Letters indicate significant post hoc differences between boxplots with asterisks indicating overall pH effects (electronic supplementary material, table S1; N = 9).

